would enable you to enjoy an array of other services such as Member Rankings, User Groups, Own Posts & Profile, Exclusive Research, Live Chat Box etc..
 Latest*


Is the ASPI in a “Bull run” by breaking the ‘Symmetrical Triangle’ pattern?
The Symmetrical Triangle (ST) is a trend continuation pattern in technical analysis. The ASPI has been treading downwards since June 2011, and according to technical analysis if an ST appears in a downtrend, the same trend should continue.

The ST actually began at Point [1], which is the lower point in the down trend. Then ASPI rallied up to point [2] and again dropped down to Point [3]. However, point [3] was higher than point [1]. Thereafter, ASPI turned upward from point [3] and from then, the lower up-slanting line (AB) can be drawn. Then the ASPI again turned down at point [4], and notice that is lower than point [2]. By drawing the upper down-slanting line (CD), we can suspect that an ST is going to be formed.
Since ASPI is in a down trend and ST is a trend continuation pattern, at point [5] there was a high chance for the ASPI to cross down the AB line. But it did not happen. Then ASPI went up to point [6]. If this is really an ST, then ASPI should come down from point [6] and cross down the AB line at point [7]. Instead of that, Wednesday (August 22, 2012) the ASPI crossed up the CD line by a big margin. This means the ST pattern has failed. In technical analysis, chartists widely use this pattern breaks nowadays to predict market trends. Therefore, the break in the down trend continuation pattern implies the trend is switching up.
ASPI; how much will it go up?
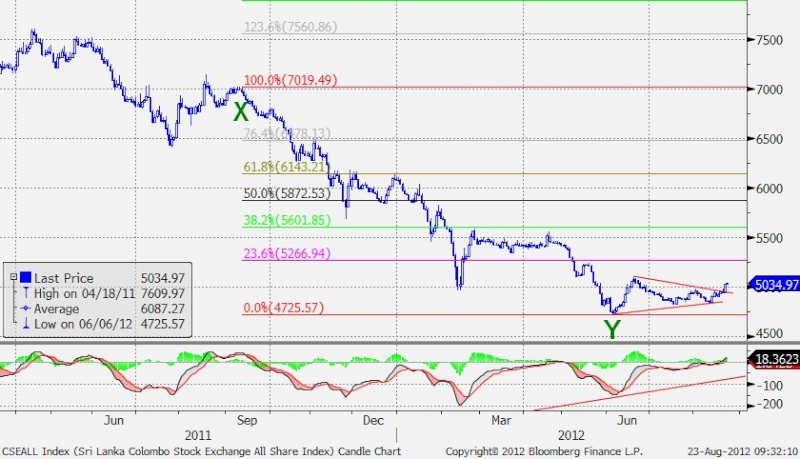
From point X (early September 2011) to Y (early June 2012), ASPI had dropped 2,293 points. For that drop we can use the Fibonacci percentage retracement to find the possible resistances in the current uptrend in the ASPI. First resistance level can be found at 5,267 which is an upside of 23.6% from the bottom at point Y. Next is at 5,602 (38.2%) and at 5,873 we can find a 50% increase from the bottom. Therefore, we can expect ASPI to reach around 5,850 if this new Bull Run continues.
The Symmetrical Triangle (ST) is a trend continuation pattern in technical analysis. The ASPI has been treading downwards since June 2011, and according to technical analysis if an ST appears in a downtrend, the same trend should continue.
The ST actually began at Point [1], which is the lower point in the down trend. Then ASPI rallied up to point [2] and again dropped down to Point [3]. However, point [3] was higher than point [1]. Thereafter, ASPI turned upward from point [3] and from then, the lower up-slanting line (AB) can be drawn. Then the ASPI again turned down at point [4], and notice that is lower than point [2]. By drawing the upper down-slanting line (CD), we can suspect that an ST is going to be formed.
Since ASPI is in a down trend and ST is a trend continuation pattern, at point [5] there was a high chance for the ASPI to cross down the AB line. But it did not happen. Then ASPI went up to point [6]. If this is really an ST, then ASPI should come down from point [6] and cross down the AB line at point [7]. Instead of that, Wednesday (August 22, 2012) the ASPI crossed up the CD line by a big margin. This means the ST pattern has failed. In technical analysis, chartists widely use this pattern breaks nowadays to predict market trends. Therefore, the break in the down trend continuation pattern implies the trend is switching up.
ASPI; how much will it go up?
From point X (early September 2011) to Y (early June 2012), ASPI had dropped 2,293 points. For that drop we can use the Fibonacci percentage retracement to find the possible resistances in the current uptrend in the ASPI. First resistance level can be found at 5,267 which is an upside of 23.6% from the bottom at point Y. Next is at 5,602 (38.2%) and at 5,873 we can find a 50% increase from the bottom. Therefore, we can expect ASPI to reach around 5,850 if this new Bull Run continues.