would enable you to enjoy an array of other services such as Member Rankings, User Groups, Own Posts & Profile, Exclusive Research, Live Chat Box etc..
 Latest*


Dear traderathome and other Harmonic price pattern experts,
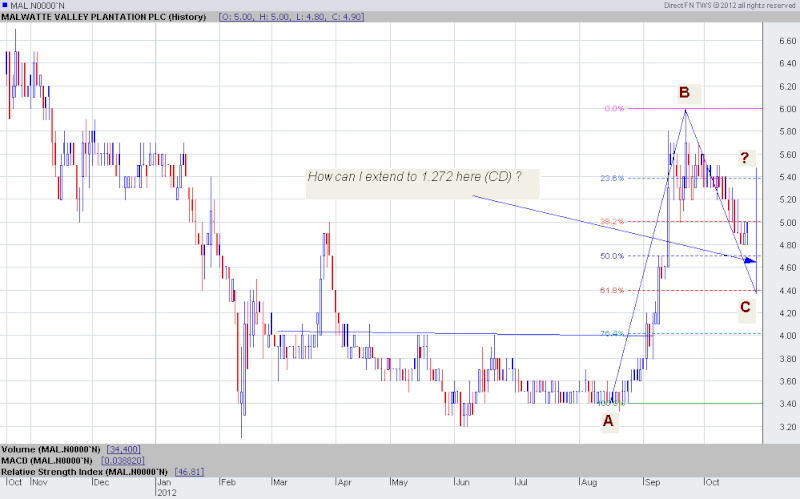
Above I have attached the bearish ABCD pattern in Harmonic price pattern.
Bellow I have mentioned the clarification of ABCD pattern in http://www.babypips.com.
Let's start this lesson with the simplest harmonic pattern, and what could be more basic than your good ole ABC's? We'll just pop in another letter right there (because we're cool like that) and we've got the ABCD chart pattern!
To spot this chart pattern, all you need are ultra-sharp hawk eyes and the handy-dandy Fibonacci tool.
For both the bullish and bearish versions of the ABCD chart pattern, the lines AB and CD are known as the legs while BC is called the correction or retracement. If you use the Fibonacci retracement tool on leg AB, the retracement BC should reach until the 0.618 level. Then, the line CD should be the 1.272 Fibonacci extension of BC.
Simple, right? All you have to do is wait for the entire pattern to complete (reach point D) before taking any short or long positions.
Oh, but if you want to be extra strict about it, here are a couple more rules for a valid ABCD pattern:
The length of line AB should be equal to the length of line CD.
The time it takes for the price to go from A to B should be equal to the time it takes for the price to move from C to D.
I'm using DirectFN charts, My question is : I can clearly see A to B and B to C retracement using Fibonacci tool in DirectFN, But How I can extend it to C to D (1.272) to see that selling point in DirectFN. to further understand my question, I have attached the MAL.N charts to show my question there.
If anybody can clarify me how to do this, I will much great full to Him/Her