would enable you to enjoy an array of other services such as Member Rankings, User Groups, Own Posts & Profile, Exclusive Research, Live Chat Box etc..
 Latest*


I'm jus trying to analyse the interpretation of indicators for BFL at the moment..
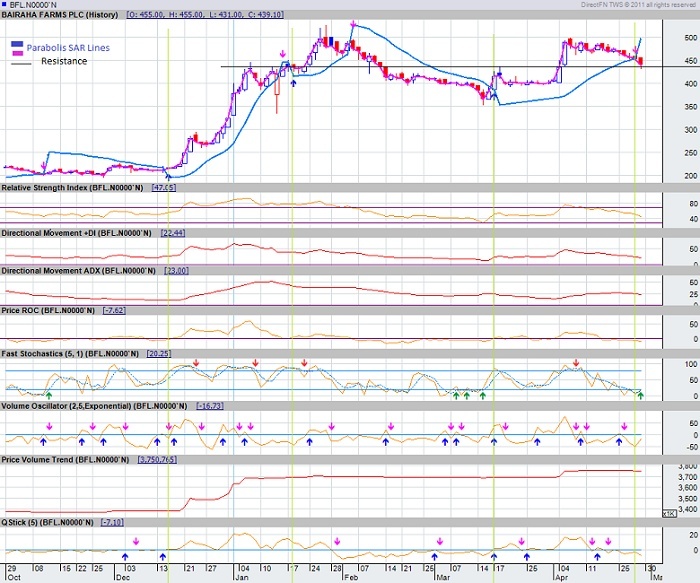
Parabolic SAR Indicator
The Parabolic SAR provides excellent exit points. You should close long positions when the price falls below the SAR and close short positions when the price rises above the SAR.
If you are long (i.e., the price is above the SAR), the SAR will move up every day, regardless of the direction the price is moving. The amount the SAR moves up depends on the amount that prices move.
Directional Movement DX
The DX consists of two parts: the Positive Directional Index (+DI) and the Negative Directional Index (-DI).
The DX's main purpose is to help identify equilibrium points in the price movement by measuring true directional movement.
The +DI line measures positive (upward) movement while the -DI measures negative (downward) movement.
+DI is a key factor in the calculation of the popular average directional index and is used to measure the presence of an uptrend. When the +DI is sloping upwards, it is a signal that the uptrend is getting stronger.
Directional Movement ADX
The ADX is a lagging indicator used to assess the strength of a trend.
This indicator can be used on any trading time frame to determine key turning points in the market.
In addition to identifying trending markets and pivots, the ADX is also used to identify choppy markets.
The ADX ranges from 0 to 100. ADX values above 40 generally imply trending markets, while readings below 20 indicate flat trading.
Price ROC
DESCRIPTION The Price Rate-of-Change (ROC) is a momentum indicator that displays the difference between the current price and the price x-time periods ago. The difference can be displayed in either points or as a percentage. The ROC displays the wave-like motion in an oscillator format by measuring the amount by which prices have changed over a given time period. As prices increase, the ROC rises and as prices fall, the ROC falls. The greater the change in prices, the greater the change in ROC.
A value greater than zero indicates an increase in upward momentum and an increase in buying pressure. Conversely a value less than zero indicates a downward momentum and an increase in selling pressure.
However, some of the most valuable signals are generated when the security's price and the ROC are heading in opposite directions (known as divergence). For example, if the security's price is increasing and the ROC is sloping downward, it is generally an early indication that a sharp decline may be on the way.
The Price Volume Trend (PVT) is a cumulative total of volume adjusted to the relative changes in the instrument’s prices. It is similar in nature to the On Balance Volume (OBV) indicator. However, unlike the OBV the PVT adds or subtracts only a portion of volume from the cumulative total in relation to the percentage of change in prices whereas the OBV adds all volume when prices close higher and subtracts all volume when prices close lower. Many traders feel this difference is a key component of the PVT that allows it to more accurately reflect the volume of money flow in and out of a trading instrument.
Price Volume Trend
The PVT can be considered a leading indicator of future price movements. A rising PVT value indicates new volume (money) flowing into the market while a declining PVT value indicates volume (money) leaving the market.
Trading signals can be generated in a few different ways using the PVT, although it is often recommended that the PVT be used in conjunction with other indicators.
In a ranging market, rising PVT values may signal a potential upward breakout while declining PVT values may signal and downward breakout.
In a trending market, the main signals from the PVT are generated by looking for divergence between the PVT indicator and the price. A bullish divergence may be an early warning sign of a market bottom and a potential upwards move in price. A bearish divergence may be an early warning sign of a market top and a potential downwards move in price.
Fast Stochastic (5,1)
A trading strategy based on the theory that prices move back and forth in waves between an overbought and oversold level. When applied on a stock chart, this strategy plots a stochastic line with the Time Period parameter set to 5 and the Slowing period parameter set to 3 and also plots a signal line which is a 3 day simple moving average of the stochastic line. This strategy interprets the possible buy/sell signals based on the crossovers that occur above or below the 70 and 30 threshold levels respectively.
Q-stick
This is an indicator used to determine the strength or weakness of a share over a given period of time. The Qstick indicator first takes the difference between the opening and closing prices of a security and creates a moving average out of it.
The interpretation of Q-stick is as follows:
1. A Q-stick value above zero is a bullish signal indicating a possible increase in a security's price. Conversely a Q-stick value below zero is a bearish signal indicating a possible decrease in a security's price.
2. Crossovers - When the indicator crosses above the zero line from below it, it is a buy signal. The reverse holds true when the indicator crosses below the zero line from above it.
3. Extreme Levels - When the Qstick indicator is at an extremely low level and turning up, it is a buy signal. When the Qstick indicator is at an extremely high level and turning down, it is a sell signal.
4. Divergences - When the Qstick indicator is moving up and the security's price is coming down, it is a buy signal. Similarly when the Qstick indicator is moving down and the security's price is going up, it is a sell signal. You may want to consider waiting for the price to confirm the new direction before placing the trade.
Chart Source & Indicator explanation is from : DirectFN TWS software
Let see what each sugest;
SAR - indicates the trend is down
Directional Movement +DI - indicates the trend is down
Directional Movement +ADX - indicates the trend is down
Price ROC - indicates the trend is down but since its below zero an upward movement could indicate BFL is heading upward
Fast Stochastics - Generates a buy signal around 439 (the green up signal at the end)
Price Volume Trend - indicates the trend is slightly downwards
Q Stick - If the indicator crosses above the zero line from current level, it is a buy signal
As u can see several indicators says the trend is down but fast stochastics gives a buy signal at 439.. So even at 430 this could look good it seems..
As per the indicators explained above.. BFL needs to be monitored for the next one-two trading days to confirm the movement..
Also the black Horizontal line I've drawn could act as a resistance level as I see it (I may be wrong, more tech guys may see this hilarious ) so the monitoring has to go now onwards..
Play safe guys..
Parabolic SAR Indicator
The Parabolic SAR provides excellent exit points. You should close long positions when the price falls below the SAR and close short positions when the price rises above the SAR.
If you are long (i.e., the price is above the SAR), the SAR will move up every day, regardless of the direction the price is moving. The amount the SAR moves up depends on the amount that prices move.
Directional Movement DX
The DX consists of two parts: the Positive Directional Index (+DI) and the Negative Directional Index (-DI).
The DX's main purpose is to help identify equilibrium points in the price movement by measuring true directional movement.
The +DI line measures positive (upward) movement while the -DI measures negative (downward) movement.
+DI is a key factor in the calculation of the popular average directional index and is used to measure the presence of an uptrend. When the +DI is sloping upwards, it is a signal that the uptrend is getting stronger.
Directional Movement ADX
The ADX is a lagging indicator used to assess the strength of a trend.
This indicator can be used on any trading time frame to determine key turning points in the market.
In addition to identifying trending markets and pivots, the ADX is also used to identify choppy markets.
The ADX ranges from 0 to 100. ADX values above 40 generally imply trending markets, while readings below 20 indicate flat trading.
Price ROC
DESCRIPTION The Price Rate-of-Change (ROC) is a momentum indicator that displays the difference between the current price and the price x-time periods ago. The difference can be displayed in either points or as a percentage. The ROC displays the wave-like motion in an oscillator format by measuring the amount by which prices have changed over a given time period. As prices increase, the ROC rises and as prices fall, the ROC falls. The greater the change in prices, the greater the change in ROC.
A value greater than zero indicates an increase in upward momentum and an increase in buying pressure. Conversely a value less than zero indicates a downward momentum and an increase in selling pressure.
However, some of the most valuable signals are generated when the security's price and the ROC are heading in opposite directions (known as divergence). For example, if the security's price is increasing and the ROC is sloping downward, it is generally an early indication that a sharp decline may be on the way.
The Price Volume Trend (PVT) is a cumulative total of volume adjusted to the relative changes in the instrument’s prices. It is similar in nature to the On Balance Volume (OBV) indicator. However, unlike the OBV the PVT adds or subtracts only a portion of volume from the cumulative total in relation to the percentage of change in prices whereas the OBV adds all volume when prices close higher and subtracts all volume when prices close lower. Many traders feel this difference is a key component of the PVT that allows it to more accurately reflect the volume of money flow in and out of a trading instrument.
Price Volume Trend
The PVT can be considered a leading indicator of future price movements. A rising PVT value indicates new volume (money) flowing into the market while a declining PVT value indicates volume (money) leaving the market.
Trading signals can be generated in a few different ways using the PVT, although it is often recommended that the PVT be used in conjunction with other indicators.
In a ranging market, rising PVT values may signal a potential upward breakout while declining PVT values may signal and downward breakout.
In a trending market, the main signals from the PVT are generated by looking for divergence between the PVT indicator and the price. A bullish divergence may be an early warning sign of a market bottom and a potential upwards move in price. A bearish divergence may be an early warning sign of a market top and a potential downwards move in price.
Fast Stochastic (5,1)
A trading strategy based on the theory that prices move back and forth in waves between an overbought and oversold level. When applied on a stock chart, this strategy plots a stochastic line with the Time Period parameter set to 5 and the Slowing period parameter set to 3 and also plots a signal line which is a 3 day simple moving average of the stochastic line. This strategy interprets the possible buy/sell signals based on the crossovers that occur above or below the 70 and 30 threshold levels respectively.
Q-stick
This is an indicator used to determine the strength or weakness of a share over a given period of time. The Qstick indicator first takes the difference between the opening and closing prices of a security and creates a moving average out of it.
The interpretation of Q-stick is as follows:
1. A Q-stick value above zero is a bullish signal indicating a possible increase in a security's price. Conversely a Q-stick value below zero is a bearish signal indicating a possible decrease in a security's price.
2. Crossovers - When the indicator crosses above the zero line from below it, it is a buy signal. The reverse holds true when the indicator crosses below the zero line from above it.
3. Extreme Levels - When the Qstick indicator is at an extremely low level and turning up, it is a buy signal. When the Qstick indicator is at an extremely high level and turning down, it is a sell signal.
4. Divergences - When the Qstick indicator is moving up and the security's price is coming down, it is a buy signal. Similarly when the Qstick indicator is moving down and the security's price is going up, it is a sell signal. You may want to consider waiting for the price to confirm the new direction before placing the trade.
Chart Source & Indicator explanation is from : DirectFN TWS software
Let see what each sugest;
SAR - indicates the trend is down
Directional Movement +DI - indicates the trend is down
Directional Movement +ADX - indicates the trend is down
Price ROC - indicates the trend is down but since its below zero an upward movement could indicate BFL is heading upward
Fast Stochastics - Generates a buy signal around 439 (the green up signal at the end)
Price Volume Trend - indicates the trend is slightly downwards
Q Stick - If the indicator crosses above the zero line from current level, it is a buy signal
As u can see several indicators says the trend is down but fast stochastics gives a buy signal at 439.. So even at 430 this could look good it seems..
As per the indicators explained above.. BFL needs to be monitored for the next one-two trading days to confirm the movement..
Also the black Horizontal line I've drawn could act as a resistance level as I see it (I may be wrong, more tech guys may see this hilarious
Play safe guys..