 would enable you to enjoy an array of other services such as Member Rankings, User Groups, Own Posts & Profile, Exclusive Research, Live Chat Box etc..
 Latest*


What Does Aroon Indicator Mean?
A technical indicator used for identifying trends in an underlying security and the likelihood that the trends will reverse. It is made up of two lines: one line is called "Aroon up", which measures the strength of the uptrend, and the other line is called "Aroon down", which measures the downtrend. The indicator reports the time it is taking for the price to reach, from a starting point, the highest and lowest points over a given time period, each reported as a percentage of total time.
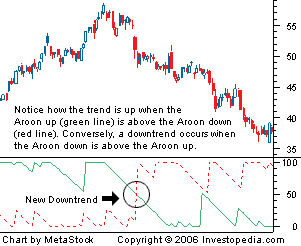
Finding The Trend With Aroon....
In 1995 Tushar Chande, a principal of Tuscarora Capital Management and author of "The New Technical Trader" (1994) and "Beyond Technical Analysis" (2001), developed the Aroon indicator to determine trend direction and strength. The indicator's greatest value is in helping traders and investors to distinguish whether a long-term trend is ending or simply stalling before another move. This article will show you how to calculate and apply the Aroon indicator to your own trading.
Calculating Aroon
The Aroon indicator can be calculated using the following formula:
If we take a look at these formulas, it is apparent that they are both looking at how recent the latest highs and lows were. Higher Aroon values indicate more recent highs and lows, while lower values indicate less recent highs and lows. Moreover, the Aroon values oscillate between 100 and 0 - a higher number indicates a stronger trend and vice versa.
The two Aroon indicators (bullish and bearish) can also be made into a single oscillator by making the bullish indicator 100 to 0 and the bearish indicator 0 to -100 and finding the difference between the two values. This oscillator then varies between 100 and -100, with 0 indicating no trend.
Using the Aroon Indicator
The Aroon indicator is used by plotting the bullish and bearish versions on the same sub-chart, or by plotting the oscillator on a single sub-chart.
The key to successfully using the Aroon indicators lies in watching two things:
[list=2][*]Crossovers Between the Bullish and Bearish Indicators - Crossovers indicate confirmations if they occur between 30 and 70. For example, if the bullish indicator crosses above the bearish indicator, it confirms a bullish trend.[/list]
Let's take a look at an example:
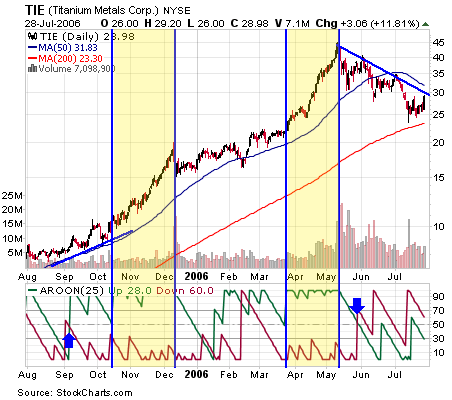
Here we have an example of Titanium Metals (TIE), a stock that recently trended strongly on increased demand for titanium. Notice that when the Aroon indicators were on opposite ends of the 30-70 barriers, the price was in a strong trend. Also note that when crossovers occurred within the 30-70 barriers, it often signaled a confirmation of the new trend.
The Aroon oscillator is a bit simpler, but provides less information. The key levels to watch are 50, 0 and -50. When the oscillator moves above 50, it indicates a strong bullish trend. When it hovers around 0, it indicates the lack of a definitive trend. And finally, when it breaks below -50, it indicates a strong bearish trend.
Let's take a look at the same chart using the oscillator:
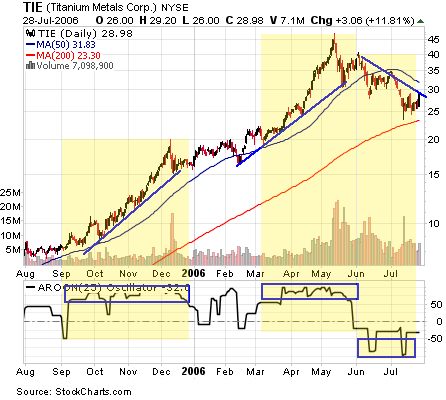
Here we can see very similar information but with a lack of confirmations because there is no crossover possible with an oscillator.
It is important to realize when looking at these charts that the Aroon indicator is lagging and, therefore, is susceptible to sharp price drops or increases. Therefore, it is very important to use other methodologies in order to exit prudently. For example, watching for high volume reversal candles is a good way to get out at the right point in the event of a sharp price reversal. Stop-loss points set at key support levels are another good way to control risk.
Investors may prefer the oscillator because it is easier to read and tends to have less contradictory signals. Meanwhile, active traders may appreciate the additional information given by the two indicators. It is up to you to determine which methodology works best for your needs and apply it to your own trading. They both offer an excellent way to determine whether a trend exists, and how strong that trend is.
Conclusion
The Aroon indicator is used best by traders and investors interested in whether or not a trend is still intact. It can help traders avoid inefficient use of capital by allowing them to seek other opportunities during sideways markets and only hold positions during strong trends. However, it is important to watch carefully and analyze stocks using other studies in conjunction with Aroon to avoid the primary weakness in this system - sharp price movements.
A technical indicator used for identifying trends in an underlying security and the likelihood that the trends will reverse. It is made up of two lines: one line is called "Aroon up", which measures the strength of the uptrend, and the other line is called "Aroon down", which measures the downtrend. The indicator reports the time it is taking for the price to reach, from a starting point, the highest and lowest points over a given time period, each reported as a percentage of total time.
Finding The Trend With Aroon....
In 1995 Tushar Chande, a principal of Tuscarora Capital Management and author of "The New Technical Trader" (1994) and "Beyond Technical Analysis" (2001), developed the Aroon indicator to determine trend direction and strength. The indicator's greatest value is in helping traders and investors to distinguish whether a long-term trend is ending or simply stalling before another move. This article will show you how to calculate and apply the Aroon indicator to your own trading.
Calculating Aroon
The Aroon indicator can be calculated using the following formula:
Bullish - [(# of periods) - (# of periods since highest high)] / (# of periods)] x 100
Bearish - [(# of periods) - (# of periods since lowest low)] / (# of periods)] x 100
If we take a look at these formulas, it is apparent that they are both looking at how recent the latest highs and lows were. Higher Aroon values indicate more recent highs and lows, while lower values indicate less recent highs and lows. Moreover, the Aroon values oscillate between 100 and 0 - a higher number indicates a stronger trend and vice versa.
The two Aroon indicators (bullish and bearish) can also be made into a single oscillator by making the bullish indicator 100 to 0 and the bearish indicator 0 to -100 and finding the difference between the two values. This oscillator then varies between 100 and -100, with 0 indicating no trend.
Using the Aroon Indicator
The Aroon indicator is used by plotting the bullish and bearish versions on the same sub-chart, or by plotting the oscillator on a single sub-chart.
The key to successfully using the Aroon indicators lies in watching two things:
- Indicator Movements Around the Key Levels, 30 and 70 - Movements above 70 indicate a strong trend, while movements below 30 indicate low trend strength. Movements between 30 and 70 indicate indecision. For example, if the bullish indicator remains above 70 while the bearish indicator remains below 30, the trend is definitively bullish.
[list=2][*]Crossovers Between the Bullish and Bearish Indicators - Crossovers indicate confirmations if they occur between 30 and 70. For example, if the bullish indicator crosses above the bearish indicator, it confirms a bullish trend.[/list]
Let's take a look at an example:
Here we have an example of Titanium Metals (TIE), a stock that recently trended strongly on increased demand for titanium. Notice that when the Aroon indicators were on opposite ends of the 30-70 barriers, the price was in a strong trend. Also note that when crossovers occurred within the 30-70 barriers, it often signaled a confirmation of the new trend.
The Aroon oscillator is a bit simpler, but provides less information. The key levels to watch are 50, 0 and -50. When the oscillator moves above 50, it indicates a strong bullish trend. When it hovers around 0, it indicates the lack of a definitive trend. And finally, when it breaks below -50, it indicates a strong bearish trend.
Let's take a look at the same chart using the oscillator:
Here we can see very similar information but with a lack of confirmations because there is no crossover possible with an oscillator.
It is important to realize when looking at these charts that the Aroon indicator is lagging and, therefore, is susceptible to sharp price drops or increases. Therefore, it is very important to use other methodologies in order to exit prudently. For example, watching for high volume reversal candles is a good way to get out at the right point in the event of a sharp price reversal. Stop-loss points set at key support levels are another good way to control risk.
Investors may prefer the oscillator because it is easier to read and tends to have less contradictory signals. Meanwhile, active traders may appreciate the additional information given by the two indicators. It is up to you to determine which methodology works best for your needs and apply it to your own trading. They both offer an excellent way to determine whether a trend exists, and how strong that trend is.
Conclusion
The Aroon indicator is used best by traders and investors interested in whether or not a trend is still intact. It can help traders avoid inefficient use of capital by allowing them to seek other opportunities during sideways markets and only hold positions during strong trends. However, it is important to watch carefully and analyze stocks using other studies in conjunction with Aroon to avoid the primary weakness in this system - sharp price movements.
by Justin Kuepper
Justin Kuepper has many years of experience in the market as an active trader and a personal retirement accounts manager. He spent a few years independently building and managing financial portals before obtaining his current position with Accelerized New Media, owner of SECFilings.com, ExecutiveDisclosure.com and other popular financial portals. Kuepper continues to write on a freelance basis, covering both finance and technology topics.
Read more: http://www.investopedia.com/articles/trading/06/aroon.asp#ixzz1SH5U9mQA


