FINANCIAL CHRONICLE™
Dear Reader,

Registration with the Sri Lanka FINANCIAL CHRONICLE™️ would enable you to enjoy an array of other services such as Member Rankings, User Groups, Own Posts & Profile, Exclusive Research, Live Chat Box etc..

All information contained in this forum is subject to Disclaimer Notice published.


Thank You
FINANCIAL CHRONICLE™️
www.srilankachronicle.com


Join the forum, it's quick and easy

FINANCIAL CHRONICLE™
Dear Reader,

Registration with the Sri Lanka FINANCIAL CHRONICLE™️ would enable you to enjoy an array of other services such as Member Rankings, User Groups, Own Posts & Profile, Exclusive Research, Live Chat Box etc..

All information contained in this forum is subject to Disclaimer Notice published.


Thank You
FINANCIAL CHRONICLE™️
www.srilankachronicle.com
FINANCIAL CHRONICLE™
Would you like to react to this message? Create an account in a few clicks or log in to continue.
FINANCIAL CHRONICLE™

Encyclopedia of Latest news, reviews, discussions and analysis of stock market and investment opportunities in Sri Lanka

Click Link to get instant AI answers to all business queries.
Click Link to find latest Economic Outlook of Sri Lanka
Click Link to view latest Research and Analysis of the key Sectors and Industries of Sri Lanka
Worried about Paying Taxes? Click Link to find answers to all your Tax related matters
Do you have a legal issues? Find instant answers to all Sri Lanka Legal queries. Click Link
Latest images

Latest topics

» Sri Lanka: Stock Market Fraudsters with Criminal Prosecutions
by D.G.Dayaratne Today at 7:28 am

» hSenid Business Solutions(HBS)
by K.R Fri May 17, 2024 9:08 am

» CBSL Pension Fund vs EPF
by God Father Thu May 16, 2024 9:13 am

» EXPO.N - Expo Lanka Holdings De-Listing
by thankrishan Wed May 15, 2024 1:58 pm

» Nations Trust Bank: Consistent growth
by ErangaDS Wed May 15, 2024 8:46 am

» SOFTLOGIC LIFE INSURANCE PLC (AAIC.N0000)
by soileconomy Wed May 15, 2024 4:01 am

» Falsified accounts and financial misrepresentation at Arpico Insurance PLC (AINS)
by DeepFreakingValue Tue May 14, 2024 12:20 am

» Potential Super Gain with HSIG
by Investment 1st Mon May 13, 2024 12:20 am

» ජනාධිපතිවරණය - 2024
by ChooBoy Sat May 11, 2024 11:20 pm

» The IMF's Monumental Malpractices and future of Sri Lanka
by ChooBoy Sat May 11, 2024 11:18 pm

» Sri Lanka: Policy Challenge Addressing Poverty Vulnerability as the Economy Recovers
by ResearchMan Fri May 10, 2024 12:20 pm

» SINS - the Tailwind effects of a crisis hit Economy
by Equity Win Thu May 09, 2024 7:37 pm

» TAFL is the most undervalued & highly potential counter in the Poultry Sector
by atdeane Thu May 09, 2024 7:09 pm

» Sri Lanka: Country Information Report
by God Father Thu May 09, 2024 5:22 pm

» Sri Lanka polls could risk economic recovery
by God Father Thu May 09, 2024 5:12 pm

» AGSTAR PLC (AGST.N0000)
by ResearchMan Thu May 09, 2024 12:21 pm

» Browns becomes world’s biggest tea exporter in deal with LIPTON
by sureshot Wed May 08, 2024 9:51 pm

» Colombo Stock Market: Over Valued against USD!
by ResearchMan Wed May 08, 2024 12:49 pm

» COCR IN TROUBLE?
by D.G.Dayaratne Mon May 06, 2024 9:31 am

» Maharaja advise - April 2024
by celtic tiger Tue Apr 30, 2024 12:01 am

» Srilanka's Access Engineering PLC think and Win
by Dasun Maduwantha Mon Apr 29, 2024 11:40 pm

» PEOPLE'S INSURANCE PLC (PINS.N0000)
by ErangaDS Fri Apr 26, 2024 10:24 am

» UNION ASSURANCE PLC (UAL.N0000)
by ErangaDS Fri Apr 26, 2024 10:22 am

» ‘Port City Colombo makes progress in attracting key investments’
by samaritan Thu Apr 25, 2024 9:26 am

» Mahaweli Reach Hotels (MRH.N)
by SL-INVESTOR Wed Apr 24, 2024 11:25 pm

LISTED COMPANIES

Submit Post
ශ්‍රී ලංකා මූල්‍ය වංශකථාව - සිංහල
Submit Post


CONATCT US


Send your suggestions and comments

* - required fields

Read FINANCIAL CHRONICLE™ Disclaimer


EXPERT CHRONICLE™

ECONOMIC CHRONICLE

GROSS DOMESTIC PRODUCT (GDP)


CHRONICLE™ YouTube


You are not connected. Please login or register

Pivot point indicator; developed by ZOOZZOO

4 posters

Go down  Message [Page 1 of 1]

NC

NC
Assistant Vice President - Equity Analytics

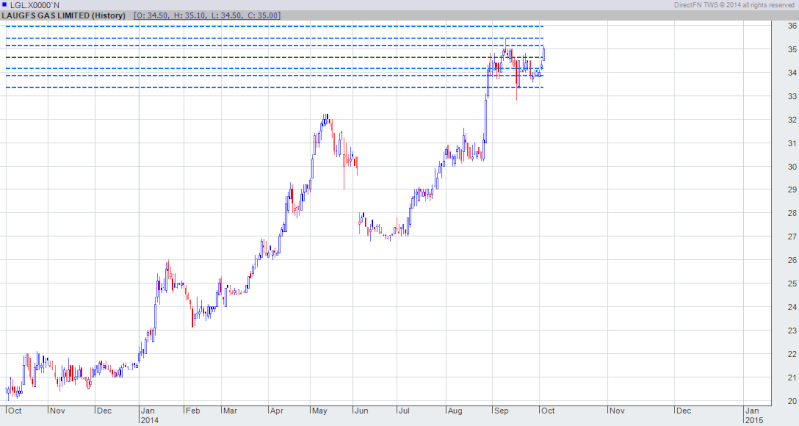
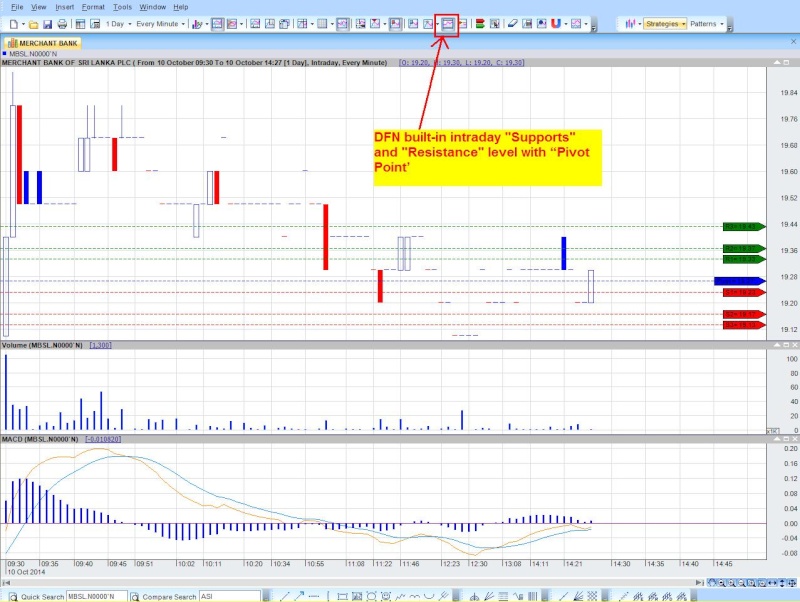
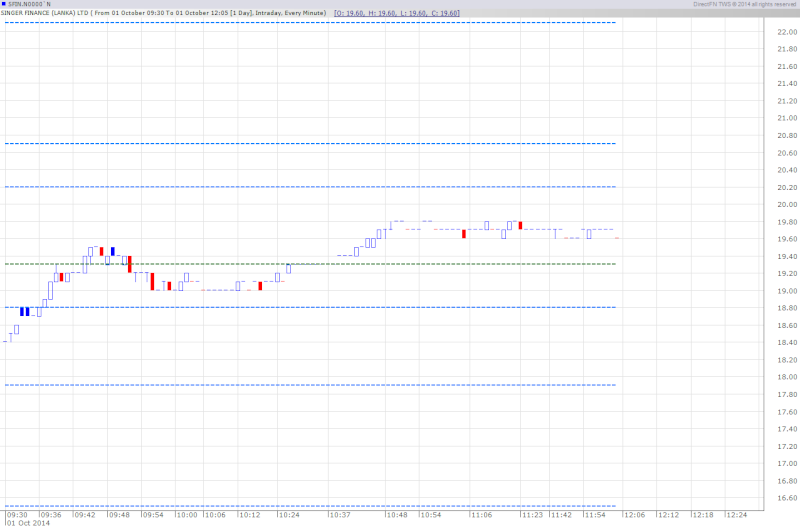
A pivot point indicator has been written by zoozzoo for DFN.

zoozzoo wrote:
i gave it a another attempt, this time you have to specify "Specific Time Period High, Specific Time Period Low and Specific Time Period Close" and then it will automatically generate pivot point, support levels and resistance levels for you. remember this is only for Specific Time Period it will not identify High, Low and Close automatically, you have to mention them manually.

to add to DFN,
tools>indicator builder>copy and paste the code>first click test icon(one forward arrow)>then click the double arrow>on upcoming window "Advanced tab">type "Short Name" as "PivotPoint">"Default insert window" choose "Same inner window as source.

hope you will use this with caution until few days, if you found any error let me know.

please feel free to use this script, no copyright


Code:
/* Pivot Point Generator By Zoozzoo */
/*
Pivot Point = [Specific Time Period High + Specific Time Period Low + Specific Time Period Close] / 3

Support Levels
 S1 = [Pivot Point * 2] - Specific Time Period High
 S2 = Pivot Point - Specific Time Period High + Specific Time Period Low
 S3 = S2 - Specific Time Period High + Specific Time Period Low

Resistance Levels
 R1 = [Pivot Point * 2] - Specific Time Period Low
 R2 = Pivot Point + Specific Time Period High - Specific Time Period Low
 R3 = R2 + Specific Time Period High - Specific Time Period Low
*/

/* Start my idea */
param double SpecificTimePeriodHigh = 0.0;
param double SpecificTimePeriodLow = 0.0;
param double SpecificTimePeriodClose = 0.0;
DataArray PP, S1, S2, S3, R1, R2, R3;

/* Pivot Point Define */
PP = ((SpecificTimePeriodHigh + SpecificTimePeriodLow + SpecificTimePeriodClose) / 3);

/* Support Levels Define */
S1 = ((PP * 2) - SpecificTimePeriodHigh);
S2 = (PP - SpecificTimePeriodHigh + SpecificTimePeriodLow);
S3 = (S2 - SpecificTimePeriodHigh + SpecificTimePeriodLow);

/* Resistance Levels Define */
R1 = ((PP * 2) - SpecificTimePeriodLow);
R2 = (PP + SpecificTimePeriodHigh - SpecificTimePeriodLow);
R3 = (R2 + SpecificTimePeriodHigh - SpecificTimePeriodLow);

plot (PP, Green, Dash, 2);

plot S1;
plot S2;
plot S3;

plot R1;
plot R2;
plot R3;

Pivot point indicator; developed by ZOOZZOO Pivot_11

http://forum.srilankaequity.com/t35978-mubasher-technology-in-a-market-manipulation-move-via-direct-fn-in-sri-lanka
Pivot point indicator is a essential tool of swing traders..
I think he'll develop this more in future. We should give him a big thank for zoozzoo, especially technical traders...!!!  Very Happy
If there're any other forum members who having such programming knowledge in DFN can contribute in this. And it'll be more easy for us for trading and develop this outdated DFN to such sophisticated level in near future with more sophisticated indicators... cheers

~ Invite for all programmers..... ~ Basketball


Last edited by NC on Wed Oct 01, 2014 6:26 pm; edited 1 time in total

NC

NC
Assistant Vice President - Equity Analytics

Pivot Points

Introduction

Pivots Points are significant levels chartists can use to determine directional movement, support and resistance. Pivot Points use the prior period's high, low and close to formulate future support and resistance. In this regard, Pivot Points are predictive or leading indicators. There are at least five different versions of Pivot Points. This article will focus on Standard Pivot Points, Demark Pivot Points and Fibonacci Pivot Points.

Pivot Points were originally used by floor traders to set key levels. Floor traders are the original day traders. They deal in a very fast moving environment with a short-term focus. At the beginning of the trading day, floor traders would look at the previous day's high, low and close to calculate a Pivot Point for the current trading day. With this Pivot Point as the base, further calculations were used to set support 1, support 2, resistance 1 and resistance 2. These levels would then be used to assist their trading throughout the day.

Time Frames

Pivot Points for 1, 5, 10 and 15 minute charts use the prior day's high, low and close. In other words, Pivot Points for today's intraday charts would be based solely on yesterday's high, low and close. Once Pivot Points are set, they do not change and remain in play throughout the day.

Conclusions

Pivot Points offer chartists a methodology to determine price direction and then set support and resistance levels. It usually starts with a cross of the Pivot Point. Sometimes the market starts above or below the Pivot Point. Support and resistance come into play after the crossover. While originally designed for floor traders, the concepts behind Pivot Points can be applied across various timeframes. As with all indicators, it is important to confirm Pivot Point signals with other aspects of technical analysis. A bearish candlestick reversal pattern could confirm a reversal at second resistance. Oversold RSI could confirm oversold conditions at second support. An upturn in MACD could be used to confirm a successful support test. On a final note, sometimes the second or third support/resistance levels are not seen on the chart. This is simply because their levels exceed the price scale on the right. In other words, they are off the chart

Classic pivot calculation

Pivot Point (P) = (High + Low + Close)/3

Support 1 (S1) = (P x 2) - High

Support 2 (S2) = P  -  (High  -  Low)

Resistance 1 (R1) = (P x 2) - Low

Resistance 2 (R2) = P + (High  -  Low)


Study more: http://stockcharts.com/school/doku.php?id=chart_school:technical_indicators:pivot_points

SHARK aka TAH

SHARK aka TAH
Expert
Expert

Welldone Zoozoo cheers

SHARK aka TAH

SHARK aka TAH
Expert
Expert

This is ASPI Chart with Zoozzo PP Indicator

Pivot point indicator; developed by ZOOZZOO Aspi10

Looks awesome zoozzo cheers

NC

NC
Assistant Vice President - Equity Analytics

SHARK aka TAH wrote:This is ASPI Chart with Zoozzo PP Indicator

Pivot point indicator; developed by ZOOZZOO Aspi10

Looks awesome zoozzo cheers

Very Happy

NC

NC
Assistant Vice President - Equity Analytics

Any Programmers .... ????
Plz comment

zoozzoo


Manager - Equity Analytics

NC wrote:Any Programmers .... ????
Plz comment

may be they haven't seen this post yet Rolling Eyes Question Sleep

NC

NC
Assistant Vice President - Equity Analytics

Pivot Point - Woodie

I rearrange, Zoozzoo's classic pivots formulas in to woodies. Here's the code. (good for weekly analysis)

Code:
/* Pivot Point - Woodie Generator By Zoozzoo & NC*/
/*
Pivot Point = [Specific Time Period High + Specific Time Period Low + Specific Time Period Open + Specific Time Period Open] / 4

Support Levels
 S1 = [Pivot Point * 2] - Specific Time Period High
 S2 = Pivot Point - [Specific Time Period High + Specific Time Period Low]
 S3 = Specific Time Period Low - 2 * [Specific Time Period High - Pivot Point]
 S4 = Pivot Point - 3 * [Specific Time Period High - Specific Time Period Low]

Resistance Levels
 R1 = [Pivot Point * 2] - Specific Time Period Low
 R2 = Pivot Point + [Specific Time Period High - Specific Time Period Low]
 R3 = 2 * [Pivot Point - Specific Time Period Low] + Specific Time Period High
 R4 = 3 * [Specific Time Period High - Specific Time Period Low] + Pivot Point
*/

/* Start my idea */
param double SpecificTimePeriodOpen = 0.0;
param double SpecificTimePeriodHigh = 0.0;
param double SpecificTimePeriodLow = 0.0;
param double SpecificTimePeriodClose = 0.0;

DataArray PP, S1, S2, S3, S4, R1, R2, R3, R4;

/* Pivot Point Define */
PP = ((SpecificTimePeriodHigh + SpecificTimePeriodLow + SpecificTimePeriodOpen + SpecificTimePeriodOpen) / 4);

/* Support Levels Define */
S1 = ((PP * 2) - SpecificTimePeriodHigh);
S2 = (PP - SpecificTimePeriodHigh + SpecificTimePeriodLow);
S3 = (SpecificTimePeriodLow - 2*(SpecificTimePeriodHigh - PP));
S4 = (PP - 3*(SpecificTimePeriodHigh - SpecificTimePeriodLow));

/* Resistance Levels Define */
R1 = ((PP * 2) - SpecificTimePeriodLow);
R2 = (PP + SpecificTimePeriodHigh - SpecificTimePeriodLow);
R3 = (2*(PP - SpecificTimePeriodLow) + SpecificTimePeriodHigh);
R4 = (3*(SpecificTimePeriodHigh - SpecificTimePeriodLow) + PP);

plot (PP, Green, Dash, 2);

plot S1;
plot S2;
plot S3;
plot S4;

plot R1;
plot R2;
plot R3;
plot R4;

Here's an example of weekly pivots of woodie of LGL.X
Pivot point indicator; developed by ZOOZZOO Lglx-p10

So, now we can do readings easily... !!!
Very Happy cheers

NC

NC
Assistant Vice President - Equity Analytics

Pivot Point - Fibonacci

Rearrange of formulas of Zoozzoo's classical pivot in to Fibonacci Pivots.
Here's the code;
Code:
/* Pivot Point - Fibonacci Generator By Zoozzoo & NC */
/*
Pivot Point = [Specific Time Period High + Specific Time Period Low + Specific Time Period Close] / 3

Support Levels
 S1 = Pivot Point - (0.382*(Specific Time Period High - Specific Time Period Low))
 S2 = Pivot Point - (0.618*(Specific Time Period High - Specific Time Period Low))
 S3 = Pivot Point - (1*(Specific Time Period High - Specific Time Period Low))

Resistance Levels
 R1 = Pivot Point + (0.382*(Specific Time Period High - Specific Time Period Low))
 R2 = Pivot Point - (0.618*(Specific Time Period High - Specific Time Period Low))
 R3 = Pivot Point - (1*(Specific Time Period High - Specific Time Period Low))
*/

/* Start my idea */
param double SpecificTimePeriodHigh = 0.0;
param double SpecificTimePeriodLow = 0.0;
param double SpecificTimePeriodClose = 0.0;
DataArray PP, S1, S2, S3, R1, R2, R3;

/* Pivot Point Define */
PP = ((SpecificTimePeriodHigh + SpecificTimePeriodLow + SpecificTimePeriodClose) / 3);

/* Support Levels Define */
S1 = (PP - (0.382*(SpecificTimePeriodHigh - SpecificTimePeriodLow)));
S2 = (PP - (0.618*(SpecificTimePeriodHigh - SpecificTimePeriodLow)));
S3 = (PP - (1*(SpecificTimePeriodHigh - SpecificTimePeriodLow)));

/* Resistance Levels Define */
R1 = (PP + (0.382*(SpecificTimePeriodHigh - SpecificTimePeriodLow)));
R2 = (PP + (0.618*(SpecificTimePeriodHigh - SpecificTimePeriodLow)));
R3 = (PP + (1*(SpecificTimePeriodHigh - SpecificTimePeriodLow)));

plot (PP, Green, Dash, 2);

plot S1;
plot S2;
plot S3;

plot R1;
plot R2;
plot R3;
 

Example of weekly fib-pivots of LGL.X
Pivot point indicator; developed by ZOOZZOO Lglx-p11

Monthly Fib-Pivots of LIOC.n
Pivot point indicator; developed by ZOOZZOO Lioc_p10

Very Happy cheers Hope these will ease our works, and raise our profits...

I'm not a programmer I just rearrange the formulas of Zoozzoos given codings..
So, again I request,
Is there any programmers in this forum, plz comment.. bounce

SHARK aka TAH

SHARK aka TAH
Expert
Expert

Thanks NC
Its good to indicate daily Pivots on ASI and S&P.. so lets continue the good works and continue the daily updates ..... in this same thread as a respect to Zoozzoo

Pivot point indicator; developed by ZOOZZOO Praising-the-lord-smiley-emoticon

NC

NC
Assistant Vice President - Equity Analytics

Hmmm... thats good..! I think he will contribute more in programming in future... Very Happy
@ zoozzoo take time and just give a try to automate as I said here, http://forum.srilankaequity.com/t35978p25-mubasher-technology-in-a-market-manipulation-move-via-direct-fn-in-sri-lanka and add label

zoozzoo


Manager - Equity Analytics

i accidentally discovered built-in "Supports" and "Resistance" level with “Pivot Point" calculater on DFN. hope you know about this. anyway if you don't know about this below image will guide.

Pivot point indicator; developed by ZOOZZOO Fd4r10

SHARK aka TAH

SHARK aka TAH
Expert
Expert

Thanks Zoozoo it works only intraday ....

NC

NC
Assistant Vice President - Equity Analytics

Pivot point indicator; developed by ZOOZZOO Asi10

Weekly Pivot of ASI:

R4 7,612.3
midpoint 7,545.4
R3 7,478.5
midpoint 7,460.4
R2 7,442.3
midpoint 7,417.9
R1 7,393.5
midpoint 7,375.4
PP 7,357.3
midpoint 7,332.9
S1 7,308.5
midpoint 7,290.4
S2 7,272.3
midpoint 7,247.9
S3 7,223.5
midpoint 7,162.9
S4 7,102.3

Current market is below the PP.
7200 is a critical point based on swing points..
Thanx zoozoo for intraday pivots. Very Happy  But, its only shows intraday, so feel not much useful  Sad

SHARK aka TAH

SHARK aka TAH
Expert
Expert

This is the Weekly Pivot Point as per Woodie Calculations.

Pivot point indicator; developed by ZOOZZOO Asi17

SHARK aka TAH

SHARK aka TAH
Expert
Expert

RES 1 =7447
RES 3 =7544
Pivot Point =7383
SUP 1 = 7289
SUP 2 =7292

Above for Week Starting 13.10.2014

NC

NC
Assistant Vice President - Equity Analytics

NC wrote:Pivot point indicator; developed by ZOOZZOO Asi10

Weekly Pivot of ASI:

R4 7,612.3
midpoint 7,545.4
R3 7,478.5
midpoint 7,460.4
R2 7,442.3
midpoint 7,417.9
R1 7,393.5
midpoint 7,375.4
PP 7,357.3
midpoint 7,332.9
S1 7,308.5
midpoint 7,290.4
S2 7,272.3
midpoint 7,247.9
S3 7,223.5
midpoint 7,162.9
S4 7,102.3

Current market is below the PP.
7200 is a critical point based on swing points..
Thanx zoozoo for intraday pivots. Very Happy  But, its only shows intraday, so feel not much useful  Sad
My critical 7200 level is broken... Next 7150, If so, trend reversal.... Question  Shocked Shocked

NC

NC
Assistant Vice President - Equity Analytics

Game 1 Change kala.... !!!
Pivot point indicator; developed by ZOOZZOO Z

Very Happy

Miranda Wijethunga

Miranda Wijethunga
Stock Trader

Could anyone please explain whether pivot points are able to generate using Atrad trading platform? Or else do we need to calculate & draw it manually using charting tools of the platform. Thank you!

Sponsored content


Back to top  Message [Page 1 of 1]

Permissions in this forum:
You cannot reply to topics in this forum