FINANCIAL CHRONICLE™
Dear Reader,

Registration with the Sri Lanka FINANCIAL CHRONICLE™️ would enable you to enjoy an array of other services such as Member Rankings, User Groups, Own Posts & Profile, Exclusive Research, Live Chat Box etc..

All information contained in this forum is subject to Disclaimer Notice published.


Thank You
FINANCIAL CHRONICLE™️
www.srilankachronicle.com


Join the forum, it's quick and easy

FINANCIAL CHRONICLE™
Dear Reader,

Registration with the Sri Lanka FINANCIAL CHRONICLE™️ would enable you to enjoy an array of other services such as Member Rankings, User Groups, Own Posts & Profile, Exclusive Research, Live Chat Box etc..

All information contained in this forum is subject to Disclaimer Notice published.


Thank You
FINANCIAL CHRONICLE™️
www.srilankachronicle.com
FINANCIAL CHRONICLE™
Would you like to react to this message? Create an account in a few clicks or log in to continue.
FINANCIAL CHRONICLE™

Encyclopedia of Latest news, reviews, discussions and analysis of stock market and investment opportunities in Sri Lanka

Click Link to get instant AI answers to all business queries.
Click Link to find latest Economic Outlook of Sri Lanka
Click Link to view latest Research and Analysis of the key Sectors and Industries of Sri Lanka
Worried about Paying Taxes? Click Link to find answers to all your Tax related matters
Do you have a legal issues? Find instant answers to all Sri Lanka Legal queries. Click Link
Latest images

Latest topics

» Will share market be taxed after new Gazette./manik de silva
by D.G.Dayaratne Mon May 27, 2024 2:14 pm

» Focus on Government controlled entities
by Ekanayake90 Mon May 27, 2024 7:31 am

» PEOPLE'S INSURANCE PLC (PINS.N0000)
by Ekanayake90 Mon May 27, 2024 7:29 am

» Seylan Bank did not pay final coupon of expired debentures
by Gaudente Wed May 22, 2024 2:32 pm

» Sri Lanka: Stock Market Fraudsters with Criminal Prosecutions
by agentnrox Wed May 22, 2024 1:50 pm

» HSENID BUSINESS SOLUTIONS PLC (HBS.N0000)
by K.R Wed May 22, 2024 7:46 am

» Richard Pieris Exports PLC (REXP.N0000) future looks bleak!
by God Father Mon May 20, 2024 10:08 pm

» Sri Lanka key Economic Indicators and Future Outlook for 2024
by God Father Mon May 20, 2024 6:06 pm

» Colombo Stock Market: Over Valued against USD!
by God Father Mon May 20, 2024 5:59 pm

» EXPO.N - Expo Lanka Holdings De-Listing
by glad Mon May 20, 2024 9:27 am

» CBSL Pension Fund vs EPF
by God Father Thu May 16, 2024 9:13 am

» Nations Trust Bank: Consistent growth
by ErangaDS Wed May 15, 2024 8:46 am

» SOFTLOGIC LIFE INSURANCE PLC (AAIC.N0000)
by soileconomy Wed May 15, 2024 4:01 am

» Falsified accounts and financial misrepresentation at Arpico Insurance PLC (AINS)
by DeepFreakingValue Tue May 14, 2024 12:20 am

» Potential Super Gain with HSIG
by Investment 1st Mon May 13, 2024 12:20 am

» ජනාධිපතිවරණය - 2024
by ChooBoy Sat May 11, 2024 11:20 pm

» The IMF's Monumental Malpractices and future of Sri Lanka
by ChooBoy Sat May 11, 2024 11:18 pm

» Sri Lanka: Policy Challenge Addressing Poverty Vulnerability as the Economy Recovers
by ResearchMan Fri May 10, 2024 12:20 pm

» SINS - the Tailwind effects of a crisis hit Economy
by Equity Win Thu May 09, 2024 7:37 pm

» TAFL is the most undervalued & highly potential counter in the Poultry Sector
by atdeane Thu May 09, 2024 7:09 pm

» Sri Lanka: Country Information Report
by God Father Thu May 09, 2024 5:22 pm

» Sri Lanka polls could risk economic recovery
by God Father Thu May 09, 2024 5:12 pm

» AGSTAR PLC (AGST.N0000)
by ResearchMan Thu May 09, 2024 12:21 pm

LISTED COMPANIES

Submit Post
ශ්‍රී ලංකා මූල්‍ය වංශකථාව - සිංහල
Submit Post


CONATCT US


Send your suggestions and comments

* - required fields

Read FINANCIAL CHRONICLE™ Disclaimer


EXPERT CHRONICLE™

ECONOMIC CHRONICLE

GROSS DOMESTIC PRODUCT (GDP)


CHRONICLE™ YouTube


You are not connected. Please login or register

ASI Technicaly

+4
hariesha
MJames
chesku
rijayasooriya
8 posters

Go down  Message [Page 1 of 1]

1ASI Technicaly Empty ASI Technicaly Fri Oct 21, 2011 11:56 am

rijayasooriya

rijayasooriya
Senior Vice President - Equity Analytics

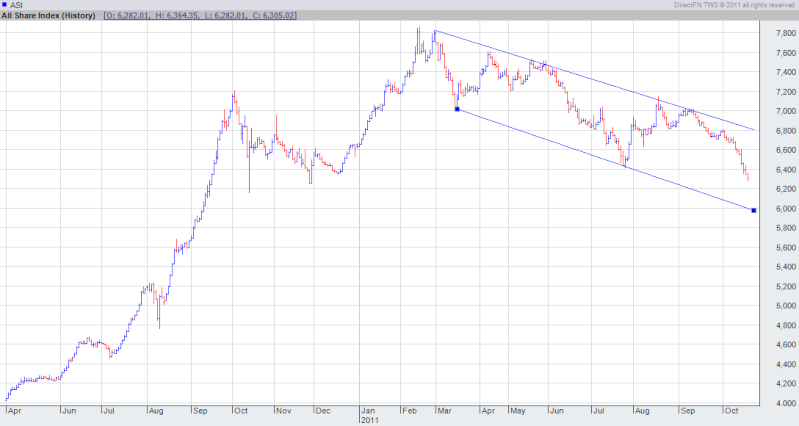
Just look at this ASI chart. It seems channel lines are applicable to current situation in CSE. In that case market is not bottomed out yet.
ASI Technicaly Asi10

2ASI Technicaly Empty Re: ASI Technicaly Fri Oct 21, 2011 1:14 pm

rijayasooriya

rijayasooriya
Senior Vice President - Equity Analytics

I think there is head and shoulder pattern. Head is somewhat distorted but the volume wise it supports the pattern.
Problem is neckline is broken as a result of which market can go further down supporting that channel line theory.
ASI Technicaly Asi_210
Comments are appreciated.

chesku


Stock Trader

Technical Analysis view on ASPI – where is it headed?

The All Share Price Index (ASPI) dropped sharply in the past few days with the index falling to its lowest on Thursday to 6,282, which is a 5.6% drop year to date and 7.4% drop month to date. Market analysts have been predicting the overheated market to correct over time but most of them did not expect such a dip within such a short time. While the ASPI picked up today, my view is more on the negative side based purely on technical analysis. Other market participants too seem to have mixed feelings about market performance going forward. The market reversal that took place can be explained by technical analysis as well.
“Head and Shoulder Top Reversal Pattern” is the best known and most reliable of all major reversal patterns according to technical analysis. This pattern contains three consecutive peaks with the middle peak (head) being the highest and the other two peaks (shoulders) being low and nearly equal. The lowest point (trough) in between the peaks can be connected to form a support level, or a neckline. When building such a pattern, there are few key points to identify it. When analyzing the ASPI we can find most of those key points in the past two years.
Go through the graph noting the following key points.
1. There was a prior up trend, which started from 2009 December (Red line) during which time the index hovered around 3,000 to 3,200.
2. In the left shoulder (ASPI value close to 7,150) there was a heavier volume followed by a corrective dip to the next trough (October 2010).
3. The Head of the pattern, rallied to a new high on lighter volume in February 2011 when the index reached 7800.
4. New trough (July 2011) came below the previous peak (7,150) at left shoulder. And also it approached the previous trough at around 6,250 in November – December, 2010.
5. Third rally or right shoulder was at lighter volumes in August 2011. This right shoulder (7,100) failed to pass the Head.
6. This month (October 2011) the ASPI started to go below the neck line. This completes the head and shoulder pattern.
Since, the ASPI met all the above points in the head and shoulder pattern; technical analysis indicates the next down side index value could be at around 5,200 for the ASPI. However, we might be able to see a little bit of support at around 6,250, at which point the index might pick up slightly. Since this is a not so strong support level, and as the ASPI just completed a Head and Shoulder Top Reversal Pattern, we can expect the ASPI to go down to 5,200 levels by end of this year.
Attachments
ASI Technicaly AttachmentTechnical Analysis view on ASPI – where is it headed.jpg
You don't have permission to download attachments.
(43 Kb) Downloaded 44 times

4ASI Technicaly Empty Interesting!! Fri Oct 21, 2011 4:51 pm

MJames


Stock Trader

Interesting analysis!! I too feel that the market need further correction.

5ASI Technicaly Empty Re: ASI Technicaly Fri Oct 21, 2011 5:01 pm

hariesha


Vice President - Equity Analytics

But unfortunately most of these incidents are artificially created by certain restrictions imposed by the regulator and subsequent relaxations. I believe these head and shoulder patterns you are talking about are random incidents. We can analyze head and shoulder patterns in a free market only.
1. October 2010 incident triggered by the price bands and subsequent credit restrictions by the regulator.
2. 3rd incident you mentioned, again initiated by the regulator by relaxing of credit restrictions in Dec. 2010.
3. 4th incident also happened due to regulator involvement on approaching the 31st March dead line and subsequent restrictions on margin facilities provided by brokers and banks.
4. The august 2011 rally also initiated by the regulator, by relaxing some of the controls.
5. Oct. 2011 also created by the regulator by sending warning letters to HNWIs.

So these are not true head and shoulder formations, as all are forcefully imposed on the market, but not initiated by the market participants.

6ASI Technicaly Empty Re: ASI Technicaly Fri Oct 21, 2011 5:10 pm

Niwa


Moderator
Moderator

What ever your technical analysis says, this optimism will continue next week as well. Why you failed to to do this analysis end of last month, if you did, you and our members could be ready selling our entire PF to collect shares at bargain price now
Hi MJames welcome to the forum .MJames,what made you think like that. pl elaborate instead of just saying that you feel.

7ASI Technicaly Empty Re: ASI Technicaly Fri Oct 21, 2011 5:40 pm

hariesha


Vice President - Equity Analytics

Most technical analysists have become historians these days. But truly TA is for to analize current and the future.

8ASI Technicaly Empty Re: ASI Technicaly Fri Oct 21, 2011 6:01 pm

Tiger

Tiger
Assistant Vice President - Equity Analytics

hariesha wrote:But unfortunately most of these incidents are artificially created by certain restrictions imposed by the regulator and subsequent relaxations. I believe these head and shoulder patterns you are talking about are random incidents. We can analyze head and shoulder patterns in a free market only.
1. October 2010 incident triggered by the price bands and subsequent credit restrictions by the regulator.
2. 3rd incident you mentioned, again initiated by the regulator by relaxing of credit restrictions in Dec. 2010.
3. 4th incident also happened due to regulator involvement on approaching the 31st March dead line and subsequent restrictions on margin facilities provided by brokers and banks.
4. The august 2011 rally also initiated by the regulator, by relaxing some of the controls.
5. Oct. 2011 also created by the regulator by sending warning letters to HNWIs.

So these are not true head and shoulder formations, as all are forcefully imposed on the market, but not initiated by the market participants.


Good post...
http://forum.srilankaequity.com/t11812-market-has-bottomed-out


9ASI Technicaly Empty Re: ASI Technicaly Fri Oct 21, 2011 7:54 pm

rijayasooriya

rijayasooriya
Senior Vice President - Equity Analytics

It is really funny some other person who has joined today is posting about this head and shoulder pattern after my post.He has posted it twice.
The other funny thing is some are commenting on this duplicate post when there is not a single comment on my post eventhough 193views.
If a moderator or adminstrator wants to merge these post I kindly request not to put my post in to that thread but the duplicate post can be put in to my thread.

10ASI Technicaly Empty Re: ASI Technicaly Fri Oct 21, 2011 9:13 pm

rijayasooriya

rijayasooriya
Senior Vice President - Equity Analytics

chesku wrote:Technical Analysis view on ASPI – where is it headed?

The All Share Price Index (ASPI) dropped sharply in the past few days with the index falling to its lowest on Thursday to 6,282, which is a 5.6% drop year to date and 7.4% drop month to date. Market analysts have been predicting the overheated market to correct over time but most of them did not expect such a dip within such a short time. While the ASPI picked up today, my view is more on the negative side based purely on technical analysis. Other market participants too seem to have mixed feelings about market performance going forward. The market reversal that took place can be explained by technical analysis as well.
“Head and Shoulder Top Reversal Pattern” is the best known and most reliable of all major reversal patterns according to technical analysis. This pattern contains three consecutive peaks with the middle peak (head) being the highest and the other two peaks (shoulders) being low and nearly equal. The lowest point (trough) in between the peaks can be connected to form a support level, or a neckline. When building such a pattern, there are few key points to identify it. When analyzing the ASPI we can find most of those key points in the past two years.
Go through the graph noting the following key points.
1. There was a prior up trend, which started from 2009 December (Red line) during which time the index hovered around 3,000 to 3,200.
2. In the left shoulder (ASPI value close to 7,150) there was a heavier volume followed by a corrective dip to the next trough (October 2010).
3. The Head of the pattern, rallied to a new high on lighter volume in February 2011 when the index reached 7800.
4. New trough (July 2011) came below the previous peak (7,150) at left shoulder. And also it approached the previous trough at around 6,250 in November – December, 2010.
5. Third rally or right shoulder was at lighter volumes in August 2011. This right shoulder (7,100) failed to pass the Head.
6. This month (October 2011) the ASPI started to go below the neck line. This completes the head and shoulder pattern.
Since, the ASPI met all the above points in the head and shoulder pattern; technical analysis indicates the next down side index value could be at around 5,200 for the ASPI. However, we might be able to see a little bit of support at around 6,250, at which point the index might pick up slightly. Since this is a not so strong support level, and as the ASPI just completed a Head and Shoulder Top Reversal Pattern, we can expect the ASPI to go down to 5,200 levels by end of this year.
Had u not noticed the following thread ? At least please check latest topics before submitting a new post.
http://forum.srilankaequity.com/t11804-asi-technicaly#78667

11ASI Technicaly Empty Re: ASI Technicaly Sat Oct 22, 2011 9:51 am

smallville

smallville
Associate Director - Equity Analytics

I see an elliot wave and some corrections.. Wink If this jumps so 6500 and falls then we gotta define some new supports..

rijayasooriya -> I took ur ASI pic fo this.. Wink

ASI Technicaly Asi10-12

I've changed this to be a little more accurate one.. Now it has H&S,Wedges and EW's..


Last edited by smallville on Sat Oct 22, 2011 9:17 pm; edited 1 time in total

12ASI Technicaly Empty Re: ASI Technicaly Sat Oct 22, 2011 12:58 pm

rijayasooriya

rijayasooriya
Senior Vice President - Equity Analytics

http://forum.srilankaequity.com/t5307-elliott-wave-theory?highlight=elliote+wave+theory
This can not be included in to EW theory.

13ASI Technicaly Empty Re: ASI Technicaly Sat Oct 22, 2011 2:28 pm

Tiger

Tiger
Assistant Vice President - Equity Analytics

I am in to buying now. affraid

14ASI Technicaly Empty Re: ASI Technicaly Sat Oct 22, 2011 7:54 pm

lokuayya


Senior Manager - Equity Analytics

sec does the things at most inappropriate times.
we have a very big gloomy situation across the world.

15ASI Technicaly Empty Re: ASI Technicaly Sat Oct 22, 2011 9:02 pm

smallville

smallville
Associate Director - Equity Analytics

rijayasooriya wrote:http://forum.srilankaequity.com/t5307-elliott-wave-theory?highlight=elliote+wave+theory
This can not be included in to EW theory.

Seems like I have some little knowledge in Techs Wink I had to take some time and redo this which I've uploaded in my earlier post..
Its not whether we put this to EW or not its about whether this has a EW pattern.. There's no ideal wave formation for EW but the C wave correction would not go to a greater extent like in ASI so a bounce back is expected
It says; In some other circumstances, the Wave 5 is so weak than it even cannot surpass the top of the wave 3, causing a double top at the end of the trend.

So ASI has H&S, Wedges & may have EW patterns too but going up to 6400-6500 and falling is not the best option that we would be looking at now.

16ASI Technicaly Empty Re: ASI Technicaly Tue Nov 15, 2011 8:21 pm

rijayasooriya

rijayasooriya
Senior Vice President - Equity Analytics

ASI follows the text book type technicals.See how neckline act as the resistance level which is not a good sign.
ASI Technicaly Asi11

Sponsored content


Back to top  Message [Page 1 of 1]

Permissions in this forum:
You cannot reply to topics in this forum