 Latest*


it is 65.65.
is it correct ? TAs pls share your thoughts

is it correct ? TAs pls share your thoughts
 would enable you to enjoy an array of other services such as Member Rankings, User Groups, Own Posts & Profile, Exclusive Research, Live Chat Box etc.. would enable you to enjoy an array of other services such as Member Rankings, User Groups, Own Posts & Profile, Exclusive Research, Live Chat Box etc..
Encyclopedia of Latest news, reviews, discussions and analysis of stock market and investment opportunities in Sri Lanka


![]()


GROSS DOMESTIC PRODUCT (GDP)

 Message [Page 1 of 2]
RSI as per yahoo Wed Oct 03, 2012 4:21 pm
 Re: RSI as per yahoo Wed Oct 03, 2012 4:25 pm

opfdo wrote:it is 65.65.
is it correct ? TAs pls share your thoughts
Re: RSI as per yahoo Wed Oct 03, 2012 4:36 pmslstock wrote:I don;t think this is accurate. We are still well above 70.opfdo wrote:it is 65.65.
is it correct ? TAs pls share your thoughts
Re: RSI as per yahoo Wed Oct 03, 2012 4:50 pmopfdo wrote:so what is the correct RSI ?slstock wrote:I don;t think this is accurate. We are still well above 70.opfdo wrote:it is 65.65.
is it correct ? TAs pls share your thoughts
Re: RSI as per yahoo Wed Oct 03, 2012 5:10 pm Re: RSI as per yahoo Wed Oct 03, 2012 5:11 pm
As per DFN RSI is 73.99slstock wrote:Different system appears to say different things.As I said it is above 70. But I beleive it should be around 73 today.
Re: RSI as per yahoo Wed Oct 03, 2012 5:16 pmDileepa wrote:The exchange has been overbought since August 28, Thomson Reuters data shows. The 14-day Relative Strength Index on Monday was at 79.582, above the upper neutral range of 70.
http://www.dailymirror.lk/business/stock/22386-bourse-slips-on-profit-taking-.html
Re: RSI as per yahoo Wed Oct 03, 2012 5:29 pm Re: RSI as per yahoo Wed Oct 03, 2012 7:29 pm


Last edited by Dileepa on Wed Oct 03, 2012 7:32 pm; edited 1 time in total (Reason for editing : spelling)
Re: RSI as per yahoo Wed Oct 03, 2012 9:19 pm
Dileepa wrote:
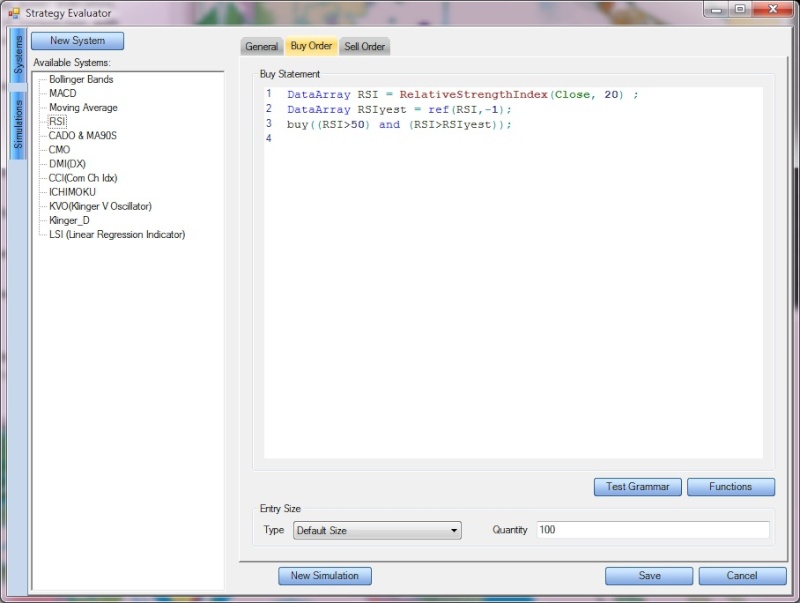
Above is a bit complex code.
For a starter, following is a simple buy & sell statement for RSI.
// RSI Buy Statement
DataArray RSI = RelativeStrengthIndex(Close, 20) ;
buy(RSI>=65);
// RSI Sell Statement
DataArray RSI = RelativeStrengthIndex(Close, 20) ;
sell(RSI<35);
Do some experiments and who knows, you might be ended up with the killer script
Re: RSI as per yahoo Wed Oct 03, 2012 9:50 pmsmallville wrote:Dileepa wrote:
Above is a bit complex code.
For a starter, following is a simple buy & sell statement for RSI.
// RSI Buy Statement
DataArray RSI = RelativeStrengthIndex(Close, 20) ;
buy(RSI>=65);
// RSI Sell Statement
DataArray RSI = RelativeStrengthIndex(Close, 20) ;
sell(RSI<35);
Do some experiments and who knows, you might be ended up with the killer script
Thanks for the neural networks introAppreciate if you could give some intro to the "Strategy Evaluator" option in DFN.. Might be useful to us...
Abt this RSI sell Statement.. Ur talking 20 bars RSI I suppose, anyways it should be RSI>80 or 90 not 35 imo.
AND HOW YOU WOULD PROGRAM THIS? WHERE U WRITE THESE STUFF.. Sorry 4 being a noob.. I can do on Ami but never tried in DFN.. Perhaps Ami code can be transferred to DFN if possible.. There could be similarities. Even if not, there are complex structures built on Ami and the idea, I mean the math could be used in DFN for better intra-day trading results..
After all, this is easier than updating AMi and drawing basic TA lines nuh?
Re: RSI as per yahoo Thu Oct 04, 2012 5:45 pmsmall, glad to hear that you are already doing it.smallville wrote:
Thanks for the neural networks intro
Abt this RSI sell Statement.. Ur talking 20 bars RSI I suppose, anyways it should be RSI>80 or 90 not 35 imo.
AND HOW YOU WOULD PROGRAM THIS? WHERE U WRITE THESE STUFF.. Sorry 4 being a noob.. I can do on Ami but never tried in DFN.. Perhaps Ami code can be transferred to DFN if possible.. There could be similarities. Even if not, there are complex structures built on Ami and the idea, I mean the math could be used in DFN for better intra-day trading results..
After all, this is easier than updating AMi and drawing basic TA lines nuh?


 yahoo shows RSI as 40.91. what it should be TAs Thu Oct 04, 2012 9:25 pm Re: RSI as per yahoo Thu Oct 04, 2012 9:46 pm Re: RSI as per yahoo Thu Oct 04, 2012 9:54 pm
smallville wrote:Thanks Dileepa.. Wonderful explanation..
Jeez..1.1GB for DFN.. that's absurd..
Re: RSI as per yahoo Thu Oct 04, 2012 9:56 pm Re: RSI as per yahoo Thu Oct 04, 2012 10:02 pmopfdo wrote:so how about the RSI as at today small ?smallville wrote:Thanks Dileepa.. Wonderful explanation..
Jeez..1.1GB for DFN.. that's absurd..
Re: RSI as per yahoo Thu Oct 04, 2012 10:18 pmsmallville wrote:opfdo wrote:so how about the RSI as at today small ?smallville wrote:Thanks Dileepa.. Wonderful explanation..
Jeez..1.1GB for DFN.. that's absurd..
67.20 as per DFN..
Re: RSI as per yahoo Thu Oct 04, 2012 10:28 pmanubis wrote:Why so much worry over RSI of the entire market?
I'd say if you want to use RSI for trading, use it on particular counters you wish to trade on. RSI is just one technical indicator, and depending on the personality of the share, RSI might or might not work.
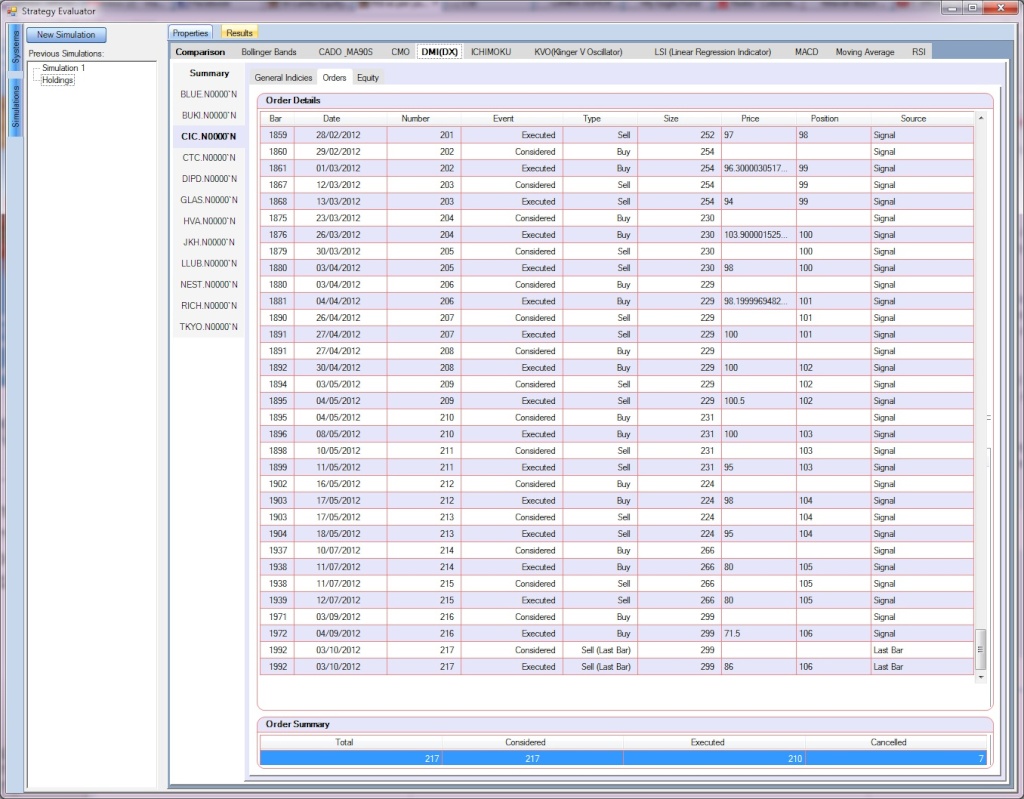
Check Dileepa's post on how to use the DFN System Tester feature to evaluate which indicator works on which share....
Cheers!
Re: RSI as per yahoo Thu Oct 04, 2012 10:32 pmanubis wrote:Why so much worry over RSI of the entire market?
I'd say if you want to use RSI for trading, use it on particular counters you wish to trade on. RSI is just one technical indicator, and depending on the personality of the share, RSI might or might not work.
Check Dileepa's post on how to use the DFN System Tester feature to evaluate which indicator works on which share....
Cheers!
Re: RSI as per yahoo Thu Oct 04, 2012 10:36 pm Re: RSI as per yahoo Fri Oct 05, 2012 9:09 amsahan8896 wrote:“I know it may sound strange to many readers, but there is an inverse relationship between analysis and trading results. More analysis or being able to make distinctions in the market’s behavior will not produce better trading results. There are many traders who find themselves caught in this exasperating loop, thinking that more or better analysis is going to give them the confidence they need to do what needs to be done to achieve success. It’s what I call a trading paradox that most traders find difficult, if not impossible to reconcile, until they realize you can’t use analysis to overcome fear of being wrong or losing money. It just doesn’t work!”
- By Mark Douglas
Re: RSI as per yahoo Fri Oct 05, 2012 9:10 amopfdo wrote:anibis, who is having DFN ? (I mean name of the brokers)
may be this question is very childish question, pls answeranubis wrote:Why so much worry over RSI of the entire market?
I'd say if you want to use RSI for trading, use it on particular counters you wish to trade on. RSI is just one technical indicator, and depending on the personality of the share, RSI might or might not work.
Check Dileepa's post on how to use the DFN System Tester feature to evaluate which indicator works on which share....
Cheers!
Re: RSI as per yahoo Fri Oct 05, 2012 12:33 pm Re: RSI as per yahoo Sat Oct 06, 2012 2:39 pmanubis wrote:@opfdo: I use Asia Securities and they offer DFN... not sure about others but DFN is fairly common.
Cheers!
Message [Page 1 of 2]
Go to page : 1, 2 ![]()
Similar topics
![]()
Permissions in this forum:
You cannot reply to topics in this forum
![]()


