FINANCIAL CHRONICLE™
Dear Reader,

Registration with the Sri Lanka FINANCIAL CHRONICLE™️ would enable you to enjoy an array of other services such as Member Rankings, User Groups, Own Posts & Profile, Exclusive Research, Live Chat Box etc..

All information contained in this forum is subject to Disclaimer Notice published.


Thank You
FINANCIAL CHRONICLE™️
www.srilankachronicle.com


Join the forum, it's quick and easy

FINANCIAL CHRONICLE™
Dear Reader,

Registration with the Sri Lanka FINANCIAL CHRONICLE™️ would enable you to enjoy an array of other services such as Member Rankings, User Groups, Own Posts & Profile, Exclusive Research, Live Chat Box etc..

All information contained in this forum is subject to Disclaimer Notice published.


Thank You
FINANCIAL CHRONICLE™️
www.srilankachronicle.com
FINANCIAL CHRONICLE™
Would you like to react to this message? Create an account in a few clicks or log in to continue.
FINANCIAL CHRONICLE™

Encyclopedia of Latest news, reviews, discussions and analysis of stock market and investment opportunities in Sri Lanka

Click Link to get instant AI answers to all business queries.
Click Link to find latest Economic Outlook of Sri Lanka
Click Link to view latest Research and Analysis of the key Sectors and Industries of Sri Lanka
Worried about Paying Taxes? Click Link to find answers to all your Tax related matters
Do you have a legal issues? Find instant answers to all Sri Lanka Legal queries. Click Link
Latest images

Latest topics

» Sri Lanka: Policy Challenge Addressing Poverty Vulnerability as the Economy Recovers
by ResearchMan Today at 12:20 pm

» SINS - the Tailwind effects of a crisis hit Economy
by Equity Win Yesterday at 7:37 pm

» TAFL is the most undervalued & highly potential counter in the Poultry Sector
by atdeane Yesterday at 7:09 pm

» Sri Lanka: Country Information Report
by God Father Yesterday at 5:22 pm

» Sri Lanka polls could risk economic recovery
by God Father Yesterday at 5:12 pm

» AGSTAR PLC (AGST.N0000)
by ResearchMan Yesterday at 12:21 pm

» Browns becomes world’s biggest tea exporter in deal with LIPTON
by sureshot Wed May 08, 2024 9:51 pm

» Colombo Stock Market: Over Valued against USD!
by ResearchMan Wed May 08, 2024 12:49 pm

» COCR IN TROUBLE?
by D.G.Dayaratne Mon May 06, 2024 9:31 am

» EXPO.N - Expo Lanka Holdings De-Listing
by eradula Tue Apr 30, 2024 3:21 pm

» Maharaja advise - April 2024
by celtic tiger Tue Apr 30, 2024 12:01 am

» Srilanka's Access Engineering PLC think and Win
by Dasun Maduwantha Mon Apr 29, 2024 11:40 pm

» PEOPLE'S INSURANCE PLC (PINS.N0000)
by ErangaDS Fri Apr 26, 2024 10:24 am

» UNION ASSURANCE PLC (UAL.N0000)
by ErangaDS Fri Apr 26, 2024 10:22 am

» ‘Port City Colombo makes progress in attracting key investments’
by samaritan Thu Apr 25, 2024 9:26 am

» Mahaweli Reach Hotels (MRH.N)
by SL-INVESTOR Wed Apr 24, 2024 11:25 pm

» THE KANDY HOTELS COMPANY (1983) PLC (KHC.N0000)
by SL-INVESTOR Wed Apr 24, 2024 11:23 pm

» ACCESS ENGINEERING PLC (AEL) Will pass IPO Price of Rs 25 ?????
by ddrperera Wed Apr 24, 2024 9:09 pm

» LANKA CREDIT AND BUSINESS FINANCE PLC (LCBF.N0000)
by Beyondsenses Wed Apr 24, 2024 10:40 am

» FIRST CAPITAL HOLDINGS PLC (CFVF.N0000)
by Beyondsenses Wed Apr 24, 2024 10:38 am

» LOLC FINANCE PLC (LOFC.N0000)
by Beyondsenses Wed Apr 24, 2024 10:20 am

» SRI LANKA TELECOM PLC (SLTL.N0000)
by sureshot Wed Apr 24, 2024 8:37 am

» Sri Lanka confident of speedy debt resolution as positive economic reforms echoes at IMF/WB meetings
by samaritan Mon Apr 22, 2024 9:28 am

» Construction Sector Boom with Purchasing manager's indices
by rukshan1234 Thu Apr 18, 2024 11:24 pm

» Asha Securities and Asia Securities Target AEL (Access Enginnering PLC )
by Anushka Perz Wed Apr 17, 2024 10:30 pm

LISTED COMPANIES

Submit Post
ශ්‍රී ලංකා මූල්‍ය වංශකථාව - සිංහල
Submit Post


CONATCT US


Send your suggestions and comments

* - required fields

Read FINANCIAL CHRONICLE™ Disclaimer


EXPERT CHRONICLE™

ECONOMIC CHRONICLE

GROSS DOMESTIC PRODUCT (GDP)


CHRONICLE™ YouTube


You are not connected. Please login or register

2011, ASI 7800 any one know about market P/E ratio at that time

+6
KDDND
NZ BOY
sriranga
LSE
K.Haputantri
stockback
10 posters

Go down  Message [Page 1 of 1]

stockback


Senior Vice President - Equity Analytics

2011, ASI 7800 any one know about market P/E ratio at that time

K.Haputantri

K.Haputantri
Co-Admin

stockback wrote:2011, ASI 7800 any one know about market P/E ratio at that time
I can not remember the amount exactly, but I know for sure it was highest in the region.

LSE

LSE
Senior Manager - Equity Analytics

stockback wrote:2011, ASI 7800 any one know about market P/E ratio at that time

2011, ASI 7800 any one know about market P/E ratio at that time Per10

Thank You.

stockback


Senior Vice President - Equity Analytics

LSE wrote:
stockback wrote:2011, ASI 7800 any one know about market P/E ratio at that time

2011, ASI 7800 any one know about market P/E ratio at that time Per10

Thank You.


Thanks. Bro

sriranga

sriranga
Co-Admin

Please find PER, PBV & DY day by day from Jan 2000 to Dec2012.

CSE Market Ratios 2000 - 2012


Source: CSE

http://sharemarket-srilanka.blogspot.co.uk/

NZ BOY

NZ BOY
Moderator
Moderator

stockback wrote:2011, ASI 7800 any one know about market P/E ratio at that time

PE= 27

KDDND

KDDND
Assistant Vice President - Equity Analytics

thx LSE! n SRI! for giving us lot of knowledge and information! cheers

as per
https://docs.google.com/spreadsheet/ccc?key=0AnQXZGA3OogVdC1GNkpQbDl4ZTFDalUwWmJyNWptMWc#gid=0

v need to pay attention when

PER - price earning ration - is low
PBV - price to book value - is low
DY - dividend yield - is high

As they are interrelated .... v got to go when (PER, PBV, DY) = (low, low, high)

Smile I am getting many good things from this forum.......!!! alien

Redbulls

Redbulls
Director - Equity Analytics

NZ BOY wrote:
stockback wrote:2011, ASI 7800 any one know about market P/E ratio at that time

PE= 27

29.5 exactly

LSE

LSE
Senior Manager - Equity Analytics

sriranga wrote:Please find PER, PBV & DY day by day from Jan 2000 to Dec2012.

CSE Market Ratios 2000 - 2012


Source: CSE

Thanx Sri.
I've depict the summary as follows.

2011, ASI 7800 any one know about market P/E ratio at that time Summar10

Redbulls

Redbulls
Director - Equity Analytics

KDDND wrote:thx LSE! n SRI! for giving us lot of knowledge and information! cheers

as per
https://docs.google.com/spreadsheet/ccc?key=0AnQXZGA3OogVdC1GNkpQbDl4ZTFDalUwWmJyNWptMWc#gid=0

v need to pay attention when

PER - price earning ration - is low
PBV - price to book value - is low
DY - dividend yield - is high

As they are interrelated .... v got to go when (PER, PBV, DY) = (low, low, high)

Smile I am getting many good things from this forum.......!!! alien

Read the following link in our forum.
http://forum.srilankaequity.com/t26349-financial-ratios-and-bankruptcy-predictions

Plus there are more to read in Chart and Expert sections in our forum.

Learning also part and parcel of Investing /Trading.
Have a great day.

LSE wrote:
sriranga wrote:Please find PER, PBV & DY day by day from Jan 2000 to Dec2012.

CSE Market Ratios 2000 - 2012


Source: CSE

Thanx Sri.
I've depict the summary as follows.

2011, ASI 7800 any one know about market P/E ratio at that time Summar10

Thanks a lot to Sri and LSE.

LSE

LSE
Senior Manager - Equity Analytics

KDDND wrote:thx LSE! n SRI! for giving us lot of knowledge and information! cheers

as per
https://docs.google.com/spreadsheet/ccc?key=0AnQXZGA3OogVdC1GNkpQbDl4ZTFDalUwWmJyNWptMWc#gid=0

v need to pay attention when

PER - price earning ration - is low
PBV - price to book value - is low
DY - dividend yield - is high

As they are interrelated .... v got to go when (PER, PBV, DY) = (low, low, high)

Smile I am getting many good things from this forum.......!!! alien
Thanx RedBulls.
wow great. Dear KDDND,
I'm really happy about you. You got the exact point. Look at the graph dear. can you find that point from there?
i mean about (PER, PBV, DY) = (low, low, high) hmmm...? did you see the starting point of that huge uptrend?

Thank You

KDDND

KDDND
Assistant Vice President - Equity Analytics


I read the link ...... http://forum.srilankaequity.com/t26349-financial-ratios-and-bankruptcy-predictions

Thx Sri! for uploading information cheers n Redbull for directing me to it! cheers Wowww...lots of ratios n indicators n factors........ is there any place where we can hv those ratios/indicator already calculated for companies in CSE???? or do v have to calculate by our own?

Thx LSE! cheers
nice graph...... yeah I can see three points in graph like (PER, PBV, DY) = (low, low, high)

they are ;
1. Aug 2000 - Dec 2000
2. Nov 2001 - March 2002
3. Nov 2008 - March 2009

After these three points... a huge up trend taken place.... Cool
Smile

so when will be the next....... Very Happy can v extend/have the graph until today....?

Thanks Again flower
KDDND

stockback


Senior Vice President - Equity Analytics

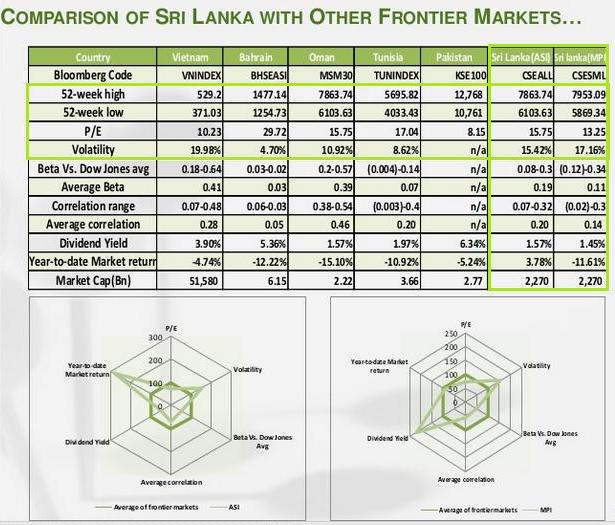
Hi all at the moment P/E is around 11.94 from bloom Berg.
source http://mobile.bloomberg.com/quote/CSEALL:IND

I don't understand this. SRI you gave very nice information. but little confusing can you explain little bit.
Thank You

Slstock

Slstock
Director - Equity Analytics


I remember Market PE around 29 in 2011.

KDDND,
You are learnign fast. Yes , usually first look at market, then the sector the share is in and start to compare as you stated below. But remember some share might be trading at low PE most times due to the nature of business. For example if you look at plantations they trade a low PE and PBV compared to market as the earning patterns change ( seasonal), world prices and gov rules, wage issues affect them.

Broker reprots usually provide these infoirmations. Else we can calculate them by looking at financial reports. There is so much info in this forum is you search. Look under help section also.


KDDND wrote:
v need to pay attention when

PER - price earning ration - is low
PBV - price to book value - is low
DY - dividend yield - is high

As they are interrelated .... v got to go when (PER, PBV, DY) = (low, low, high)

Smile I am getting many good things from this forum.......!!! alien

Redbulls

Redbulls
Director - Equity Analytics

@KDDND
Try this also
http://forum.srilankaequity.com/t10930-stock-valuation-eps-growth-pe-ratio-method

Slstock

Slstock
Director - Equity Analytics

PE can be calculated as forward or trailing.

For example :

ABC company reported
March 31 2012- Eps of 3
June 2012 - Eps of 2
Sept 2012 - Eps 3
Dec 2012 - Eps 4

Last 4 quarter trailing EPS is (3+2+3+4)=Rs 12
Forward EPs can be = (3+4)x2= Rs 14

If ABC sahre price is at Rs 120
Trailing PE is 120/12=10
Forward PE = 120/14=8.5

Same applies to overall market PE.
Now you will see why Market PE is stated by CSE as 16.3 while bloomsberg says 11.3.


stockback wrote:Hi all at the moment P/E is around 11.94 from bloom Berg.
source http://mobile.bloomberg.com/quote/CSEALL:IND

I don't understand this. SRI you gave very nice information. but little confusing can you explain little bit.
Thank You

KDDND

KDDND
Assistant Vice President - Equity Analytics

Thank you slstock!

For giving me a push to my learning process.... a helping hand!

if I get your advice correctly..... this is my conclusion......

first I need to look in to whole market's [CSE's] values ...
so, the following of the CSE
PER - price earning ration - is low
PBV - price to book value - is low
DY - dividend yield - is high

then select a sector... preferably a sector which better when compare - benchmark against CSE values ... that mean each sector's PER, PBV, DY against CSE's PER PBV DY.....

then select a company from that sector....comparing sector's PER, PBV, DY against individual company's PER PBV DY.....

then select a company to trade..... Smile good rational n logical selection Smile
Thats COOL! Thanx slstock!

If say honestly! I was like why MASK, WATA are not hitting high? their EPS are like 3.66 & 2.66 per 9months ending 13 12 2012! u gave me the reasons... Basketball

I got many teachers in this forum! I am really enjoying this learning process!
coz the subject is interesting n the people I met in this forum is very helpful n useful! alien alien


slstock wrote:
I remember Market PE around 29 in 2011.

KDDND,
You are learnign fast. Yes , usually first look at market, then the sector the share is in and start to compare as you stated below. But remember some share might be trading at low PE most times due to the nature of business. For example if you look at plantations they trade a low PE and PBV compared to market as the earning patterns change ( seasonal), world prices and gov rules, wage issues affect them.

Broker reprots usually provide these infoirmations. Else we can calculate them by looking at financial reports. There is so much info in this forum is you search. Look under help section also.


KDDND wrote:
v need to pay attention when

PER - price earning ration - is low
PBV - price to book value - is low
DY - dividend yield - is high

As they are interrelated .... v got to go when (PER, PBV, DY) = (low, low, high)

Smile I am getting many good things from this forum.......!!! alien

Redbulls

Redbulls
Director - Equity Analytics

@KDDND
As Slstock mentioned, brokers weekly report also give some ideas.
For Example try the following link.(Key Performance Indicator)
http://research.srilankaequity.com/t710-capital-trust-weekly-market-statistics-key-performance-indicators-26-04-2013

KDDND

KDDND
Assistant Vice President - Equity Analytics

Thx Redbull!

I am doing home work well! Reading both the links u sent to me!

in the links..."http://research.srilankaequity.com/t710-capital-trust-weekly-market-statistics-key-performance-indicators-26-04-2013"

it says;

Weekly Market Statistics 227 - 24 04 2013.pdf
You don't have permission to download attachments.(301 Kb) Crying or Very sad

What I need to do to get access to these documents? scratch

Slstock

Slstock
Director - Equity Analytics

Register a seperate or same username/password in the research section to access.

KDDND wrote:Thx Redbull!

I am doing home work well! Reading both the links u sent to me!

in the links..."http://research.srilankaequity.com/t710-capital-trust-weekly-market-statistics-key-performance-indicators-26-04-2013"

it says;

Weekly Market Statistics 227 - 24 04 2013.pdf
You don't have permission to download attachments.(301 Kb) Crying or Very sad

What I need to do to get access to these documents? scratch

bullrun

bullrun
Assistant Vice President - Equity Analytics

All these hard work shows that everybody is expecting a good time. I too feel "kuch kuch will hothahe"

Jana1


Assistant Vice President - Equity Analytics

LSE wrote:
KDDND wrote:thx LSE! n SRI! for giving us lot of knowledge and information! cheers

as per
https://docs.google.com/spreadsheet/ccc?key=0AnQXZGA3OogVdC1GNkpQbDl4ZTFDalUwWmJyNWptMWc#gid=0

v need to pay attention when

PER - price earning ration - is low
PBV - price to book value - is low
DY - dividend yield - is high

As they are interrelated .... v got to go when (PER, PBV, DY) = (low, low, high)

Smile I am getting many good things from this forum.......!!! alien
Thanx RedBulls.
wow great. Dear KDDND,
I'm really happy about you. You got the exact point. Look at the graph dear. can you find that point from there?
i mean about (PER, PBV, DY) = (low, low, high) hmmm...? did you see the starting point of that huge uptrend?

Thank You

For this uptrend, the reason was end of war. Not your underlined reason, and the drop of nasty PE ratio also due to severity of the war...

stockback


Senior Vice President - Equity Analytics

"Now you will see why Market PE is stated by CSE as 16.3 while bloomsberg says 11.3. "

Thank You very much for helping. I am confusing with which one is correct.
bloomberg or cse.

I think CSE calculating according to year end reports. bloomberg calculating according to last quarter. Am I correct?
please tell me CSE and BloomBerg P/E ratios.

KDDND

KDDND
Assistant Vice President - Equity Analytics

Jana1 wrote:
LSE wrote:
KDDND wrote:thx LSE! n SRI! for giving us lot of knowledge and information! cheers

as per
https://docs.google.com/spreadsheet/ccc?key=0AnQXZGA3OogVdC1GNkpQbDl4ZTFDalUwWmJyNWptMWc#gid=0

v need to pay attention when

PER - price earning ration - is low
PBV - price to book value - is low
DY - dividend yield - is high

As they are interrelated .... v got to go when (PER, PBV, DY) = (low, low, high)

Smile I am getting many good things from this forum.......!!! alien
Thanx RedBulls.
wow great. Dear KDDND,
I'm really happy about you. You got the exact point. Look at the graph dear. can you find that point from there?
i mean about (PER, PBV, DY) = (low, low, high) hmmm...? did you see the starting point of that huge uptrend?

Thank You

For this uptrend, the reason was end of war. Not your underlined reason, and the drop of nasty PE ratio also due to severity of the war...

Jana1!
Dear I appreciate your contribution to this post Smile

V were talking ....how to analyze & understand the whole market, sectors and individuals company.... from the point of figures & some sort of analyses.... in order to pick a company to invest or trade its shares!!!

We didn't discuss what are the reasons for change of values of those indicators or market.

What you said is reason for change of values of PER, PBV, DY at that times..... yes u r right......
1.WAR
2.Lack of POLITICAL STABILITY
3.poor ECONOMY
4.....
5.....

Actually v did not focus on reasons for change of values PER, PBV, DY.... though there may be some INTERNAL & EXTERNAL reason as far as any single company considered!

Thx again Jana1 alien


Sponsored content


Back to top  Message [Page 1 of 1]

Permissions in this forum:
You cannot reply to topics in this forum