would enable you to enjoy an array of other services such as Member Rankings, User Groups, Own Posts & Profile, Exclusive Research, Live Chat Box etc..
 Latest*


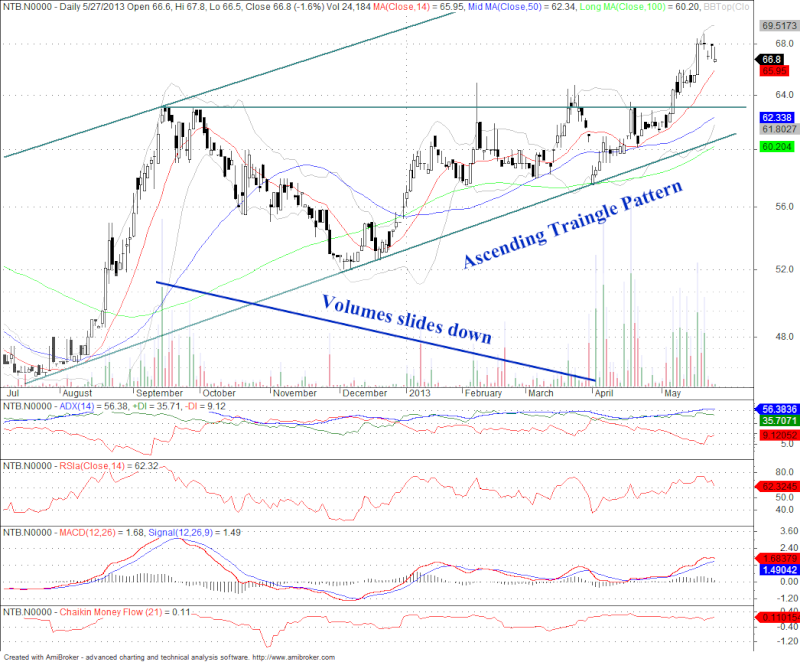
NTB - Ascending Traingle pattern.
Regardless of where they form, ascending triangles are bullish patterns that indicate accumulation.
As the pattern develops, volume usually contracts. When the upside breakout occurs, high volume support usually occurs to confirm the breakout. Though volume confirmation gives a positive indication, it is not always necessary.
When the horizontal resistance line of the ascending triangle is broken, it turns into support. Sometimes there will be a return to this support level before the move begins in earnest.
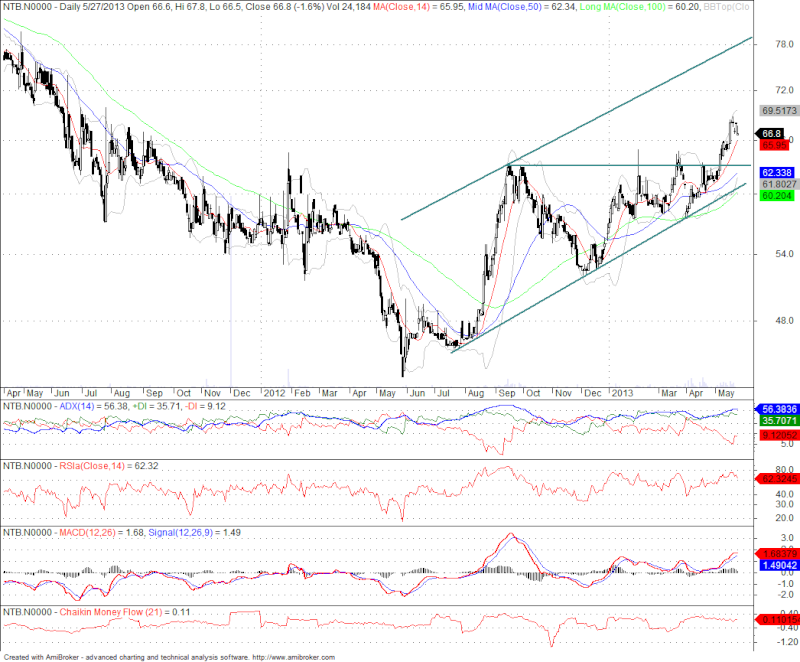
Price target usually is taken as the widest distance of the pattern and draw the distance by measuring it from the breakout level. This means 80-85 level from the current price.
The above was based on TA.
Regardless of where they form, ascending triangles are bullish patterns that indicate accumulation.
As the pattern develops, volume usually contracts. When the upside breakout occurs, high volume support usually occurs to confirm the breakout. Though volume confirmation gives a positive indication, it is not always necessary.
When the horizontal resistance line of the ascending triangle is broken, it turns into support. Sometimes there will be a return to this support level before the move begins in earnest.
Price target usually is taken as the widest distance of the pattern and draw the distance by measuring it from the breakout level. This means 80-85 level from the current price.
The above was based on TA.