FINANCIAL CHRONICLE™
Dear Reader,

Registration with the Sri Lanka FINANCIAL CHRONICLE™️ would enable you to enjoy an array of other services such as Member Rankings, User Groups, Own Posts & Profile, Exclusive Research, Live Chat Box etc..

All information contained in this forum is subject to Disclaimer Notice published.


Thank You
FINANCIAL CHRONICLE™️
www.srilankachronicle.com


Join the forum, it's quick and easy

FINANCIAL CHRONICLE™
Dear Reader,

Registration with the Sri Lanka FINANCIAL CHRONICLE™️ would enable you to enjoy an array of other services such as Member Rankings, User Groups, Own Posts & Profile, Exclusive Research, Live Chat Box etc..

All information contained in this forum is subject to Disclaimer Notice published.


Thank You
FINANCIAL CHRONICLE™️
www.srilankachronicle.com
FINANCIAL CHRONICLE™
Would you like to react to this message? Create an account in a few clicks or log in to continue.
FINANCIAL CHRONICLE™

Encyclopedia of Latest news, reviews, discussions and analysis of stock market and investment opportunities in Sri Lanka

Click Link to get instant AI answers to all business queries.
Click Link to find latest Economic Outlook of Sri Lanka
Click Link to view latest Research and Analysis of the key Sectors and Industries of Sri Lanka
Worried about Paying Taxes? Click Link to find answers to all your Tax related matters
Do you have a legal issues? Find instant answers to all Sri Lanka Legal queries. Click Link
Latest images

Latest topics

» Hotel Sigiriya (HSIG) most undervalued & huge profit making Hotel
by Chalitha Tharanga Yesterday at 6:44 pm

» Mahaweli Reach Hotels (MRH.N)
by Chalitha Tharanga Yesterday at 6:41 pm

» Banking Sector (3Q 2024)
by ADVENTUS Yesterday at 5:33 pm

» CSE to turn bullish after November 14 poll
by Rare Yesterday at 10:13 am

» ලාභ විජ්ජාව!!
by D.G.Dayaratne Mon Nov 18, 2024 8:11 pm

» Prepare to be blown away..
by cpriya Mon Nov 18, 2024 1:05 am

» ‘Buy the Rumour, Sell the News’
by God Father Sat Nov 16, 2024 12:00 pm

» Asian stocks drift higher amid rate cut speculation; Japan lags
by Rare Sat Nov 16, 2024 9:56 am

» Oil prices fall further
by Rare Sat Nov 16, 2024 9:40 am

» Post-election winners.
by Rare Sat Nov 16, 2024 9:36 am

» Bullish about a sustainable turnaround - CSE Chairman
by Rare Sat Nov 16, 2024 9:25 am

» Plantation Companies
by Rare Sat Nov 16, 2024 9:19 am

» COMMERCIAL BANK OF CEYLON PLC (COMB.N0000)
by EPS Thu Nov 14, 2024 10:31 pm

» People's leasing VS Singer Finance IPO Analysis
by ddrperera Wed Nov 13, 2024 8:18 pm

» Insights into LOLC Advanced Technologies
by samaritan Wed Nov 13, 2024 10:41 am

» LOLC Tech's ambitious plans for global expansion
by samaritan Tue Nov 12, 2024 2:06 pm

» PLANTATION SECTOR
by God Father Sun Nov 10, 2024 8:19 pm

» People's leasing company, a hidden gem? (an analysis)
by Nandana Withanage Sun Nov 10, 2024 6:56 pm

» PEOPLE'S LEASING BUYING SIGNAL Target Price 19 ..PLEASE KEEP EYE ON THIS..
by nilantha suranga Sun Nov 10, 2024 9:16 am

» Peoples leasing technically positive Target Price Rs 20
by Shiranli Sun Nov 10, 2024 7:43 am

» Quarterly Research Updates (Sep 2024)
by God Father Sun Nov 10, 2024 7:42 am

» Peoples Leasing....!!! whts the target?
by rajithasahan Sun Nov 10, 2024 7:35 am

» PEOPLE'S LEASING & FINANCE PLC
by mafasmunaseer Sun Nov 10, 2024 12:45 am

LISTED COMPANIES

Submit Post
ශ්‍රී ලංකා මූල්‍ය වංශකථාව - සිංහල
Submit Post


CONATCT US


Send your suggestions and comments

* - required fields

Read FINANCIAL CHRONICLE™ Disclaimer


EXPERT CHRONICLE™

ECONOMIC CHRONICLE

GROSS DOMESTIC PRODUCT (GDP)


CHRONICLE™ YouTube


You are not connected. Please login or register

Year ended 31st December 2013 - Trends and stats

+15
The Alchemist
Expert
sahan8896
pushpakumara
knockknobbler
prasadrmb
Leon
seek
K.Haputantri
sriranga
nihal123
kalum
Gaja
Slstock
nrod
19 posters

Go to page : 1, 2  Next

Go down  Message [Page 1 of 2]

nrod


Stock Analytic
Stock Analytic

The year 2013 had 242 days of Trading. The no of red days were 106, and 136 days were green. The year open was at 5642.87, the high was 6494.09, low was 5604.59, and closed at 5912.78. The annualized return was + 4.78%.

There had been 9 trends during the year( 5 up trends, 4 down
trends), and the following are the details:

1. 6TH DEC'12 TO 18TH JAN'13 - UPTREND

TREND OPEN - 5327.10
TREND CLOSE - 5875.77
NO. DAYS - 28 DAYS
INCREASE - 10.3%

2. 21ST JAN'13 TO 5TH MAR'13 - DOWN TREND

TREND OPEN 5879.39
TREND CLOSE 5626.27
NO. DAYS - 29 DAYS
DECREASE (4.31%)

3. 6TH MAR'13 TO 23TH MAY'13 - UPTREND

TREND OPEN - 5625.63
TREND CLOSE - 6488.85
NO.DAYS - 54 DAYS
INCREASE - 15.34%

4. 27TH MAY'13 TO 17TH JULY'13 - DOWN TREND

TREND OPEN - 6494.09
TREND CLOSE - 5982.35
NO.DAY - 38 DAYS
DECREASE - (7.88%)

5. 18TH JULY'13 TO 16TH AUG'13 - UPTREND

TREND OPEN - 5981.38
TREND CLOSE - 6233.21
NO.DAYS - 20 DAYS
INCREASE - 4.21%

6. 19TH AUG'13 TO 9TH SEPT'13 - DOWN TREND

TREND OPEN - 6234.16
TREND CLOSE - 5605.26
NO.DAYS - 15 DAYS
DECREASE - (10.09%)

7. 10TH SEPT'13 TO 17TH OCT'13 - UPTREND

TREND OPEN - 5695.37
TREND CLOSE - 5976.51
NO.DAYS - 25 DAYS
INCREASE - 4.94%

8. 27TH OCT'13 TO 27TH NOV'13 - DOWNTREND

TREND OPEN - 5977.38
TREND CLOSE - 5744.67
NO.DAYS - 28 DAYS
DECREASE - (3.9%)

9. PRESENT TREND - 28TH NOV'13 TO 31ST DEC'13 - UPTREND

TREND OPEN - 5744.29
TREND CLOSE - 5912.78
NO.DAYS - 22 DAYS
INCREASE - 2.93%
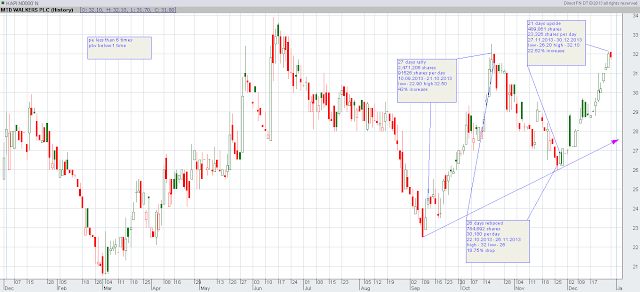
Year ended 31st December 2013 - Trends and stats Kapi

Slstock

Slstock
Director - Equity Analytics

Very useful info. Thanks.

Gaja


Associate Director - Equity Analytics

Thanks for the time and info friend, continue ur good work

kalum


Senior Manager - Equity Analytics

Thanks nrod. Smile

nihal123

nihal123
Manager - Equity Analytics

Thanks
nrod
good job continue
 Very Happy 

sriranga

sriranga
Co-Admin

Thanks a lot nrod. Really appreciate your contribution. Expecting more contribution from you.
Happy New Year.

http://sharemarket-srilanka.blogspot.co.uk/

K.Haputantri

K.Haputantri
Co-Admin

nrod, good analysis. Keep it up.

seek


Senior Manager - Equity Analytics

Thanx. usefull.

Leon


Assistant Vice President - Equity Analytics

good to see some analysis. @ nrod, can't you do the same for separate shares like JKH, SAMP

prasadrmb

prasadrmb
Manager - Equity Analytics

useful, thanks

nrod


Stock Analytic
Stock Analytic

Thanx to all. @ leon yes I'm watching the stocks too. Shall post asap. My main intention is to avoid getting involved with unwanted issues, when I'm posting. Hence I take a lot of care Smile

Slstock

Slstock
Director - Equity Analytics

Smart guy.

nrod wrote:Thanx to all. @ leon yes I'm watching the stocks too. Shall post asap. My main intention is to avoid getting involved with unwanted issues, when I'm posting. Hence I take a lot of care Smile

knockknobbler


Manager - Equity Analytics

nrod wrote:

There had been 9 trends during the year( 5 up trends, 4 down
trends), and........

]

Congratulations ....!
you have earned praise from Admins', Moderators, Senior managers ......( within 2 days and 3 posts).
However, pardon me for offering a different view.
As I see ....., there is no trend /s in 2013, only sideways trading.

Slstock

Slstock
Director - Equity Analytics

Knock,
I think you are commenting on the overall CSE pictue of 2013 taking the start and the end into consideration. YEs it was not much of a trend except of over 4% gain in rupee terms ( $ is lesser)


But Nrod here has broken down the 2013 into several short term cycles which made up the over the final result.


knockknobbler wrote:
nrod wrote:

There had been 9 trends during the year( 5 up trends, 4 down
trends), and........

]

Congratulations ....!
you have earned praise from Admins', Moderators, Senior managers ......( within 2 days and 3 posts).
However, pardon me for offering a different view.
As I see ....., there is no trend /s in 2013, only sideways trading.

nrod


Stock Analytic
Stock Analytic

knockknobbler wrote:
nrod wrote:

There had been 9 trends during the year( 5 up trends, 4 down
trends), and........

]

Congratulations ....!
you have earned praise from Admins', Moderators, Senior managers ......( within 2 days and 3 posts).
However, pardon me for offering a different view.
As I see ....., there is no trend /s in 2013, only sideways trading.

Thanks for your thoughts. I shall be pleased to see your chart for the period from 1st Jan 2013 to 31 Dec 2013. Along with your view too. Thank you once again.

pushpakumara


Senior Manager - Equity Analytics

Thanks a lot nrod. I was looking for this info. and you have hit right on the spot. Good work.
It is about 7% growth is not it? Have you got starting and ending index (ASI) figures for 2009,2010,2011 and 2012 as well? If not do not worry.


Last edited by pushpakumara on Thu Jan 02, 2014 8:03 pm; edited 1 time in total

knockknobbler


Manager - Equity Analytics

slstock wrote:Knock,
I think you are commenting on the overall CSE pictue of 2013 taking the start and the end into consideration. YEs it was not much of a trend except of over 4% gain in rupee terms ( $ is lesser)

But Nrod here has broken down the 2013 into several short term cycles which made up the over the final result.

Appreciate your comment, and the focus on end results.
However, my opinion is based on ASI behavior, in between.
The basic  question  here is,
can... the ASI behavior in several short term cycles lasting few days...be interpreted as TREND ?

knockknobbler


Manager - Equity Analytics

nrod wrote:
Thanks for your thoughts. I shall be pleased to see your chart for the period from 1st Jan 2013 to 31 Dec 2013. Along with your view too. Thank you once again.

Sorry, mate,
I am not sure how to upload Charts, Excel Tables here.
Besides, I am not disputing your chart.
It may be the interpretation of a TREND. ( see my comment to slstock, also )

nrod


Stock Analytic
Stock Analytic

knockknobbler wrote:
slstock wrote:Knock,
I think you are commenting on the overall CSE pictue of 2013 taking the start and the end into consideration. YEs it was not much of a trend except of over 4% gain in rupee terms ( $ is lesser)

But Nrod here has broken down the 2013 into several short term cycles which made up the over the final result.

Appreciate your comment, and the focus on end results.
However, my opinion is based on ASI behavior, in between.
The basic  question  here is,
can... the ASI behavior in several short term cycles lasting few days...be interpreted as TREND ?

May I so humbly point out that the shortest no of days in my post was 15 days between 19th Aug'13 TO 9th Sept'13, and the market descended 10.09%. From my view point it is a huge decline, therefore for me the information is highly useful and critical. Another point to remember here is the 9th trend which is the present trend. Today is the 23rd day of the trend, and keeping an eye on the present trend, keep counting it while looking at other charts in your watch list, for their behavior, using the oscillators and indicators, is very important. That way you can no doubt be a complete trader/investor. As I mentioned about the watch list here, may I add that it will be ideal to watch the strong companies first as for the market to go up they must go up first. How ever if you are a chartist then your watch list can be based on your trading rules and trade setups. So to sum it up, 15 days is not a few days, instead every trend allows you to give you the freedom to make your call,i.e. to enter or exit.

In order to make your self clear, I think you can use your online trading system to give you charts to upload in to your post, as I've done in both my posts. I have direct fn and it is very easy to copy and paste using that. I suppose any other system the brokers are providing to their clients can be used to do that. Best Regards.

nrod


Stock Analytic
Stock Analytic

pushpakumara wrote:Thanks a lot nrod. I was looking for this info. and you have hit right on the spot. Good work.
It is about 7% growth is not it? Have you got starting and ending index (ASI) figures for 2009,2010,2011 and 2012 as well? If not do not worry.

Thanks for your comments. You see these ups and downs can be interpreted in many ways. Yes if you add the ups and subtract the downs you may get 7%. But you can also go trend wise. Meaning if you have entered in to the present trend( trend opened on the 28th of Nov'13 ), meaning at any day within the trend, you must follow the trend,and react when the trend is reversing. Some say trend is your friend, it is true only if you are friends with the chart that shows you the direction of the trend. I can work out yester  year figures, but I think that tracking the present trend is more useful. As I mentioned in the above reply, today is the 23rd day of the present trend, but if you take the opening of the ASI which is 5744.29 and today's close of 5968.04 in the present trend, that is an increase of 223.75 points or 3.9%, for that period of 23 days. But as you know many stocks have given returns greater than that during that period. So looking at the ASI is critical, but monitoring your watch list during that period is more important. Best regards.

pushpakumara


Senior Manager - Equity Analytics

nrod wrote:
pushpakumara wrote:Thanks a lot nrod. I was looking for this info. and you have hit right on the spot. Good work.
It is about 7% growth is not it? Have you got starting and ending index (ASI) figures for 2009,2010,2011 and 2012 as well? If not do not worry.

Thanks for your comments. You see these ups and downs can be interpreted in many ways. Yes if you add the ups and subtract the downs you may get 7%. But you can also go trend wise. Meaning if you have entered in to the present trend( trend opened on the 28th of Nov'13 ), meaning at any day within the trend, you must follow the trend,and react when the trend is reversing. Some say trend is your friend, it is true only if you are friends with the chart that shows you the direction of the trend. I can work out yester  year figures, but I think that tracking the present trend is more useful. As I mentioned in the above reply, today is the 23rd day of the present trend, but if you take the opening of the ASI which is 5744.29 and today's close of 5968.04 in the present trend, that is an increase of 223.75 points or 3.9%, for that period of 23 days. But as you know many stocks have given returns greater than that during that period. So looking at the ASI is critical, but monitoring your watch list during that period is more important. Best regards.

Thanks nirod for the detailed reply and for your time.

sahan8896


Assistant Vice President - Equity Analytics

but monitoring your watch list during that period is more important.
Liked that part,Other thing is always there will be shares which will outperform the index whether it's red or green.If you can Identify them early you will be a winner.

Expert

Expert
Manager - Equity Analytics

nrod,
You are a Great Analyst. And apparently, you are making good use of your analysis. It is best to make use of whatever is available without getting entangled in meanings of words. Thanks a lot for sharing your findings with us; allowing many here to benefit. I appreciate very much, your selfless work.

The Alchemist


Senior Manager - Equity Analytics

@nrod - great analysis ! keep up the good work !
all the best for 2014.

smallville

smallville
Associate Director - Equity Analytics

Very good analysis... Keep these coming.. All the best for a great year ahead..

Sponsored content


Back to top  Message [Page 1 of 2]

Go to page : 1, 2  Next

Permissions in this forum:
You cannot reply to topics in this forum