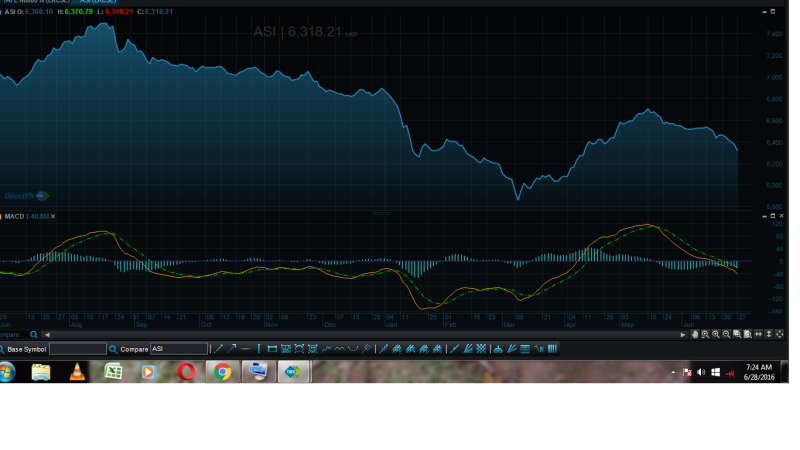
This is the ASI chart with MACD. On 2016/03/15 macd line (yellow line) crosses the signal line upward and asi became bullish from that point. The bullish pattern confirms further when macd line crosses the 0 line on April 7.
May 8, macd line crosses the signal line downward and asi became bearish. Bearishness confirmed when the macd crosses 0 line on 15 june. Still macd in negative region as well under the signal line.. So I think friends better to wait atleast till we see the macd line crosses the signal line upward. Then if macd crosses 0 line and go to positive region could be a very good sign.
Friends, I am still in a learning process and like your comments and advices in this regard.
 would enable you to enjoy an array of other services such as Member Rankings, User Groups, Own Posts & Profile, Exclusive Research, Live Chat Box etc..
 Home
Home


