01

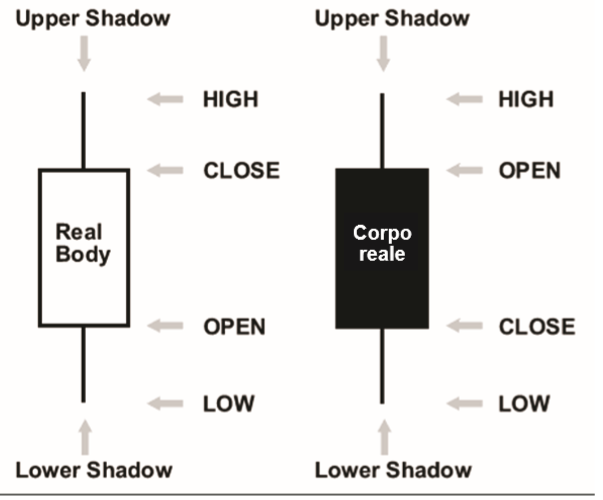
In the example below where the body has been filled in with black, the opening price is shown by the top of the body while the closing price is denoted by the bottom of the body. This signifies that during this time period the price declined in value. If the body was instead White then it means that the closing price is higher than the opening price and an increase in value
02

03

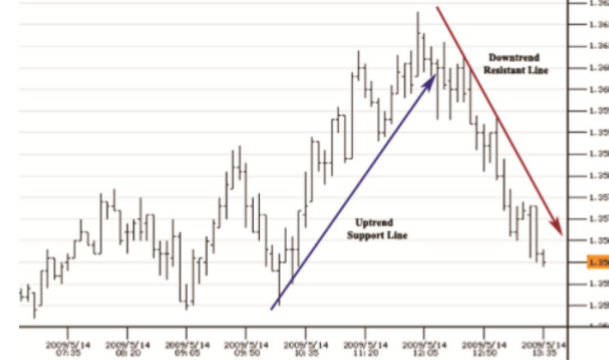
Trend Reversal Trend reversal simply means that the course of market prices is changing direction, or that the “trading trend” has broken down, whereas in an uptrend prices noticeably failed to make a new high, and are now breaching (or going through) what was once a price support level. This failure clearly shows that something has changed and a reevaluation needs to take place.
04

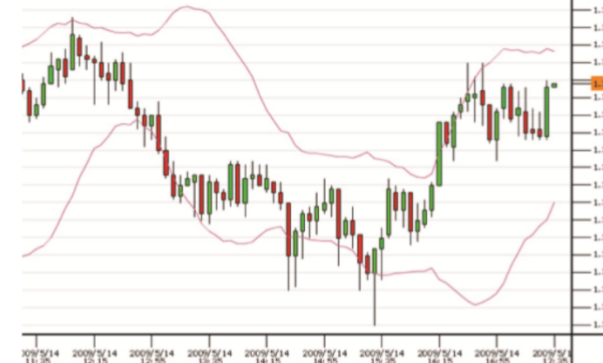
Bollinger Bands Bollinger Bands usually have a 20 day simple moving average (that can be hidden) surrounded by 2 lines (or bands) that are 1 standard deviation (+1 and -1) from the moving average price. These bands tend to capture most currency price moves within them, though they also clearly show when prices are overbought/sold, when prices touch, or extend through either line.
Bollinger bands are utilized to measure the volatility in a market. Essentially, these bands indicate if the market is quiet or volatile. They contract when the market is quiet and expand when the market is volatile. With reference to the figure below, you can see that the bands are closer to each other when there are less price fluctuations (low volatility) whereas they expand when the prices become more volatile.
05

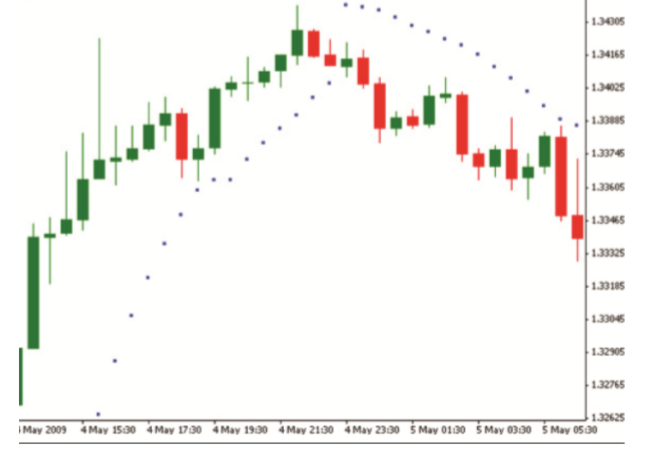
Parabolic SAR So far we have focused on technical indicators for isolating new trends, or confirming established ones. As important as that is, it is equally critical that we are able to when a trend is ending. In short, knowing when to exit the market is as important as entering the market.
(content from www.investing.com)
 would enable you to enjoy an array of other services such as Member Rankings, User Groups, Own Posts & Profile, Exclusive Research, Live Chat Box etc..
 Home
Home


