 Latest*


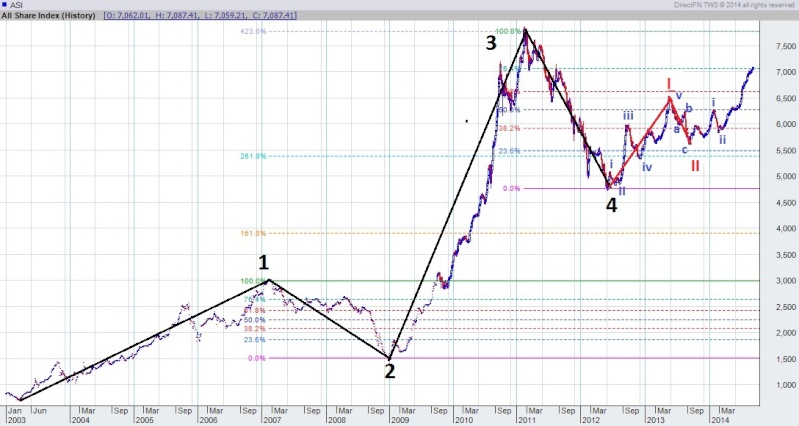
I did bit elliot wave count, on all history and recent.. It shows me attractive forecast.
(Note: Sometimes, I may make some mistakes on counting waves.)
(Note: Sometimes, I may make some mistakes on counting waves.)
 would enable you to enjoy an array of other services such as Member Rankings, User Groups, Own Posts & Profile, Exclusive Research, Live Chat Box etc.. would enable you to enjoy an array of other services such as Member Rankings, User Groups, Own Posts & Profile, Exclusive Research, Live Chat Box etc..
Encyclopedia of Latest news, reviews, discussions and analysis of stock market and investment opportunities in Sri Lanka


![]()


GROSS DOMESTIC PRODUCT (GDP)

 Message [Page 1 of 1]
Elliot Wave Analysis of ASI (all history) Sun Sep 07, 2014 6:48 pm
 Re: Elliot Wave Analysis of ASI (all history) Sun Sep 07, 2014 6:51 pm
 Re: Elliot Wave Analysis of ASI (all history) Sun Sep 07, 2014 6:55 pm
NC wrote:I did bit elliot wave count, on all history and recent.. It shows me attractive forecast.
(Note: Sometimes, I may make some mistakes on counting waves.)
Re: Elliot Wave Analysis of ASI (all history) Sun Sep 07, 2014 7:08 pmNC wrote:Above chart is all year history,
And this one is 3 years history, (minor counts)
Re: Elliot Wave Analysis of ASI (all history) Sun Sep 07, 2014 7:17 pm
 Re: Elliot Wave Analysis of ASI (all history) Sun Sep 07, 2014 7:25 pm Re: Elliot Wave Analysis of ASI (all history) Sun Sep 07, 2014 7:45 pm
As per mine we are in to 3W and could complete @7100 7200 or 7500 as long as 6500 is not broken correction.NC wrote:NC wrote:Above chart is all year history,
And this one is 3 years history, (minor counts)
On this minor countings, its still runs the 3rd wave:
possible targets (Red - capital roman nos)
1.61 ext: 7000 (already hit)
2.61 ext: 7850
4.23 ext: 9200
Possible targets (black- simple roman) (short counting)
1.61 ext: 6500 (already passed)
2.61 ext: 7000 (already hit)
4.23 ext: 7750
So, these all minor counting seems still running 3rd wave. And seems it haven't start its 5th (final impulse leg).
So over all, I think ASI may have a long run than what we think.. Based on analysis, ASI will break 7800 in future, before any major correction...
Re: Elliot Wave Analysis of ASI (all history) Sun Sep 07, 2014 7:54 pm Re: Elliot Wave Analysis of ASI (all history) Sun Sep 07, 2014 8:37 pmSometimes, I may have done some mistakes on ratios. I'll recheck it.SHARK wrote:As per mine we are in to 3W and could complete @7100 7200 or 7500 as long as 6500 is not broken correction.NC wrote:NC wrote:Above chart is all year history,
And this one is 3 years history, (minor counts)
On this minor countings, its still runs the 3rd wave:
possible targets (Red - capital roman nos)
1.61 ext: 7000 (already hit)
2.61 ext: 7850
4.23 ext: 9200
Possible targets (black- simple roman) (short counting)
1.61 ext: 6500 (already passed)
2.61 ext: 7000 (already hit)
4.23 ext: 7750
So, these all minor counting seems still running 3rd wave. And seems it haven't start its 5th (final impulse leg).
So over all, I think ASI may have a long run than what we think.. Based on analysis, ASI will break 7800 in future, before any major correction...
Lets check this tonight
Re: Elliot Wave Analysis of ASI (all history) Sun Sep 07, 2014 8:38 pm Re: Elliot Wave Analysis of ASI (all history) Sun Sep 07, 2014 8:51 pm
NC wrote:Sometimes, I may have done some mistakes on ratios. I'll recheck it.SHARK wrote:As per mine we are in to 3W and could complete @7100 7200 or 7500 as long as 6500 is not broken correction.NC wrote:NC wrote:Above chart is all year history,
And this one is 3 years history, (minor counts)
On this minor countings, its still runs the 3rd wave:
possible targets (Red - capital roman nos)
1.61 ext: 7000 (already hit)
2.61 ext: 7850
4.23 ext: 9200
Possible targets (black- simple roman) (short counting)
1.61 ext: 6500 (already passed)
2.61 ext: 7000 (already hit)
4.23 ext: 7750
So, these all minor counting seems still running 3rd wave. And seems it haven't start its 5th (final impulse leg).
So over all, I think ASI may have a long run than what we think.. Based on analysis, ASI will break 7800 in future, before any major correction...
Lets check this tonight
Thanx
Re: Elliot Wave Analysis of ASI (all history) Mon Sep 08, 2014 7:32 am Re: Elliot Wave Analysis of ASI (all history) Mon Sep 08, 2014 10:22 amindi009 wrote:I don't understand............. This is like greek to me.......................
Can someone please tell me are we at 3rd wave, if so 3rd wave will run upto what extent??? I mean what is the highest point the ASPI will reach on 3rd wave??
As far as I understand 4th wave is something that the market having the correction.... If so market should come down.............. Please tell me upto what extent the market will come down???? Will it come down to 6500 levels or 6700 levels....................
Pls
Re: Elliot Wave Analysis of ASI (all history) Mon Sep 08, 2014 10:32 amAnd I forgot to say, these targets are for the simple roman (black) counting.(mini trend), For capital roman counting 3rd wave targets are 7600 or 9400 or 12 200. Don't mess all. These are very long term targets.NC wrote:indi009 wrote:I don't understand............. This is like greek to me.......................
Can someone please tell me are we at 3rd wave, if so 3rd wave will run upto what extent??? I mean what is the highest point the ASPI will reach on 3rd wave??
As far as I understand 4th wave is something that the market having the correction.... If so market should come down.............. Please tell me upto what extent the market will come down???? Will it come down to 6500 levels or 6700 levels....................
Pls
According to my counting, 3rd wave targets are 7250 or 8300. Since, 8300 looks unrealistic, possibly, 3rd wave will end up around 7300. But it doesn't mean that 8300 is not achieveble. We cannot exactly say it. but most of our psychological level is 7300. So if it end 7300, correction will be either 6700 or 6500.So mostly between those two levels.
And dont try to understand this elliotwave counting, its really hard to do correct count. So I may have done some mistakes too..
Re: Elliot Wave Analysis of ASI (all history) Tue Sep 09, 2014 8:59 am
 Re: Elliot Wave Analysis of ASI (all history) Tue Sep 09, 2014 9:52 am Re: Elliot Wave Analysis of ASI (all history) Tue Sep 09, 2014 9:55 am Re: Elliot Wave Analysis of ASI (all history) Tue Sep 09, 2014 10:22 am
NC wrote:@Puliyanam, I think next 2 months we can hope this run will hit 7100 -7200. And from November to 2015 first couple of months market will pull back market around 6700. After the pull back market will break 7500 and move towards 9100. And in between 2016 to 2017 market may hit 9100. So, I can only say to such period.
When, as long as we'are predicting such long period the accuracy becomes low and low. So, I think its useless, and its not easy task since, we're in end of 2014.
So, break of 11,000 I think after 2020.
Seems like palm readings ne
(feels reading the horoscope of ASI
Re: Elliot Wave Analysis of ASI (all history) Tue Sep 09, 2014 12:55 pm Re: Elliot Wave Analysis of ASI (all history) Tue Sep 09, 2014 1:15 pm Re: Elliot Wave Analysis of ASI (all history) Tue Sep 09, 2014 5:11 pmFollow this website. There're more but, for a beginner this site is good. http://stockcharts.com/school/doku.php?id=chart_school:chart_analysisMaximillion wrote:Dear Shark/NC,
I wish to learn the technical analysis & charts. Can you help me? Please tell the information sources to start with. Much appreciate your kind assistance
Re: Elliot Wave Analysis of ASI (all history) Tue Sep 09, 2014 5:18 pmTry to learn some basics above chaos and fractals..you can google. here are some valuable lecs by a Pro.NC wrote:Follow this website. There're more but, for a beginner this site is good. http://stockcharts.com/school/doku.php?id=chart_school:chart_analysisMaximillion wrote:Dear Shark/NC,
I wish to learn the technical analysis & charts. Can you help me? Please tell the information sources to start with. Much appreciate your kind assistance
Message [Page 1 of 1]
Permissions in this forum:
You cannot reply to topics in this forum
![]()


