Profit after Tax
Last 3 quarters
31.12.2010 – 227.4 Mn
30.09.2010 – 214.9 Mn
30.06.2010 – 125.3 Mn
9 month Earnings - 567.6 Mn
Expected PAT for 31.03.2011 estimating a 50% growth from December quarter
227.4 * 150% = 341.1 Mn
Basis :
KVAL has recorded a 48% increase from previous quarter. And considering favorable market conditions and being the largest rubber plantation. Taking 50% would be justifiable. As seen from KAVL and other plantation results heavy rains in the period didn't have any significant impact on production.
Expected Earnings
567.6 + 341.1 = 908.7 Mn
Making a 10% provision for audit changes
908.7 * 90% = 817.83 Mn (118 % growth from FY 2009/2010)
* In FY2009/2010 audited results had appreciated 2% over quarterly results.
Issued Shares : 25 Mn
Expected EPS
817.83 / 25 = 32.71
Current CSE plantation PER 17.5
so 32.71 X 17.5 = Rs. 572.43
Being more prudent taking 16-05-11 stock tracker report of NDB securities plantation sector PE 8.28
32.71 X 8.28 = Rs. 270.80
12 month trailing EPS
(237 + 567.6) / 25 = 32.81
Trailing PE (Price @20/05 Rs.230)
230 / 32.81 = 7.01
Technical Analysis
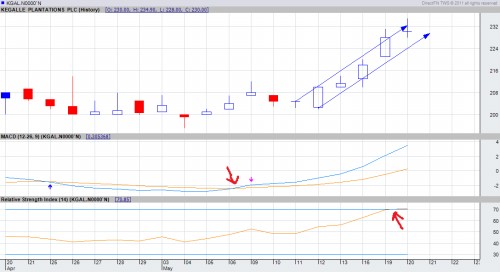
1 month Candlestick chart for KGAL.N0000

As seen from this chart KGAL is forming a nice up trend pattern with successive higher highs and lower lows. MACD also confirms the upward momentum. RSI is slightly crossing into the overbought region and this can slowdown the upward momentum a little bit. Forming of the "Doji" indicate Buying pressure and selling pressure getting equal. So this may come down a little before going up again.
So from this technical analysis we can see at least for short term KGAL is in bull run.
Conclusion
Purely mathematical fair value calculation with lots of assumptions.
Looking at these calculations I think Rs. 300 limit can be easily achievable.
Comments are welcome.
Last edited by xhora on Fri May 20, 2011 10:18 pm; edited 4 times in total
 would enable you to enjoy an array of other services such as Member Rankings, User Groups, Own Posts & Profile, Exclusive Research, Live Chat Box etc..
 Home
Home


