Candle Stick
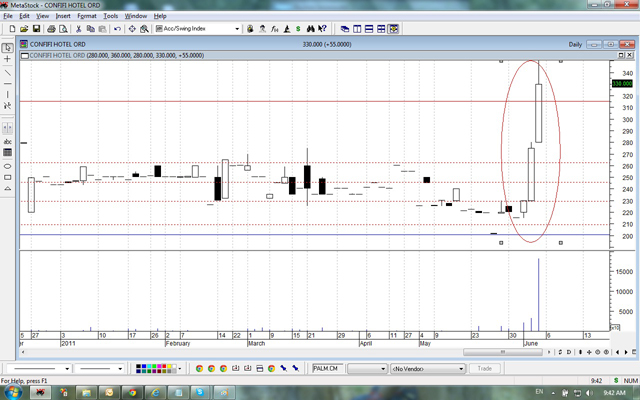
If you analyze last three days trading with candlestick it has formed three big white candles. This is very similar to three whit soldiers pattern. This is generally considered bullish, as prices closed significantly higher than they opened. If the candle appears when prices are "low," it may be the first sign of a bottom. If it occurs when prices are rebounding off of a support area (e.g., a moving average, trendline, or retracement level), the long white candle adds credibility to the support. Similarly, if the candle appears during a breakout above a resistance area, the long white candle adds credibility to the breakout.
Fibonacci
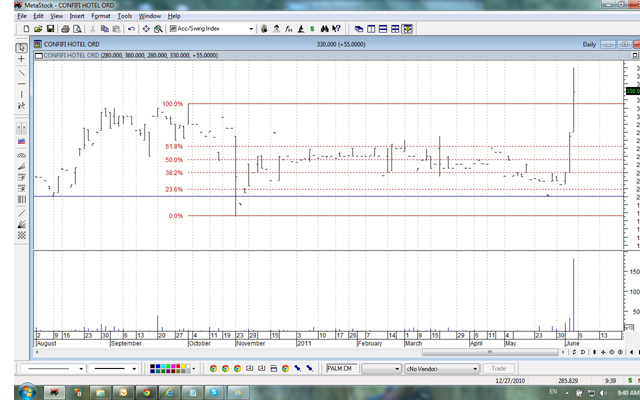
As you can see in the chart PALM has rebounded off of 61.8% retracement level with a white candle stick and it has broken all retracement levels with a big white candle on 02/06/2011. It has then broken the resistance level at 315 with another big candle. This is clear evidence that there can be an upward movement on Monday.
In addition to price chart it was noticed that PALM has been accumulated by investors during last few days and money flow into the share is upward and positive.
Please see graph below

Bollinger Bands
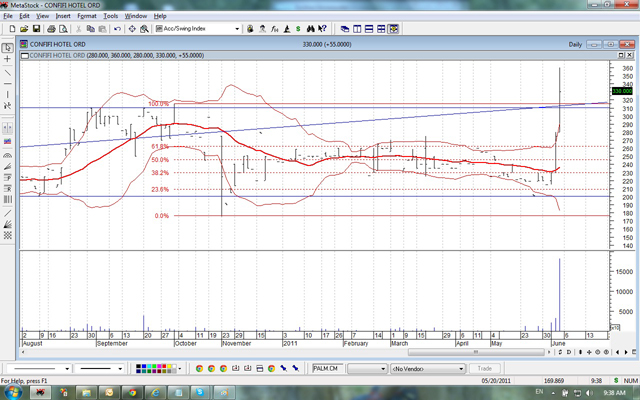
Bollinger bands suggest that volatility can be increased in the near future as both upper band and lower band started to open up. PALM was in a trading range before 27/5 and it is now slowly entering into a trending range as Bollinger band suggests in the graph. PALM will move in the direction of the upper band in the near future.
Please see graph below

 would enable you to enjoy an array of other services such as Member Rankings, User Groups, Own Posts & Profile, Exclusive Research, Live Chat Box etc..
 Home
Home


