would enable you to enjoy an array of other services such as Member Rankings, User Groups, Own Posts & Profile, Exclusive Research, Live Chat Box etc..
 Latest*


I have to admit that I've not analysed ASI for sometime... Well TBHW I've not analysed a single share lately..
For the following analysis I've taken the line chart from Bloomberg rather than OHLC due to clarity of lines first then later on decided to test my patience with DFN hence I've uploaded the DFN analysis too..

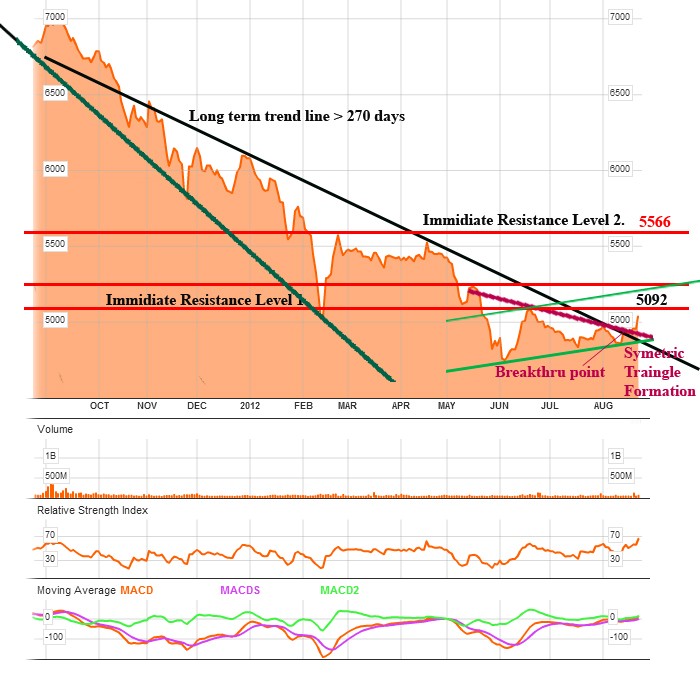
In the above charts, you can see a traingle kinda shape formation near the end of trading days (Maroon & bottom Green trend lines in Bloomberg chart & Green slope up/down lines in DFN chart). The shape has formed thru lower highs and higher lows.
I beleive this to be a symmetrical Triangle (overview of this pattern below). Well I cant be wrong since I analysed it from two chart models
A Symmetrical triangles marks important trend reversals or continuation of the current trend.
It was said that; regardless of the nature of the pattern, continuation or reversal, the direction of the next major move can only be determined after a valid breakout.
Now we also have a breakout with an improved volume participation. But wonder whether this is enuf??
I've drawn 2 parellel lines (green lines) where a confirmative target is desired.
Therefore this to be a continuation trend, ASI has to break 5200-5260 range (sorry!! my vision has some problem or the bloomberg chart though clear enuf, not clear in range targets).

The closest Fibonacci resistance (23%) is given as 5462. But the DFN figures dont match with visual figures. Hence I expect the range for 23% Fib to be in 5320-5340
In conclution, we have to expect the ASI to break 5200-5260 range for a better confirmation, then we have to watch the breaking of 23% Fib (5320-5340) to be identified as a true bull
Today (24-08-12) market tradin at a negative note..
Note : Even sophisticateed traders have agreed that the reversal patterns can be especially difficult to analyze and often have false breakouts.
Cons or Word of caution - This can eventually be a fake trend till a new SEC head is appointed and the approval of resignation of ex-SEC chief. So better take positions carefully.
The symmetrical Triangle (Continuation)
The symmetrical Triangle (Continuation) is formed out of two converging trend lines and is neither bullish nor bearish in terms of future price direction (it can be a continuation or reversal pattern)
The triangle pattern usually has two or three tops and bottoms, forming the basis for trend lines and afterwards you can expect the trend line to be broken. A broker trend line of the triangle pattern suggests the completion of the pattern and this should happen at about 2/3 of the horizontal length of the pattern - much earlier than the trend lines merge.
The volume is normally reducing with the pattern formation, but on the breakout the volume is above average.
This refers to the quiet before the storm, or the tightening consolidation before the breakout.
If the breakout is not supported with higher volume, you should be very careful when trading this pattern.
Breakout Confirmation: For a break to be considered valid, it should be on a closing basis. Some traders apply a price (3% break) or time (sustained for 3 days) filter to confirm validity. The breakout should occur with an expansion in volume, especially on upside breakouts.
Confirmation is especially important for upside breakouts.
source : http://stockcharts.com
For the following analysis I've taken the line chart from Bloomberg rather than OHLC due to clarity of lines first then later on decided to test my patience with DFN hence I've uploaded the DFN analysis too..
In the above charts, you can see a traingle kinda shape formation near the end of trading days (Maroon & bottom Green trend lines in Bloomberg chart & Green slope up/down lines in DFN chart). The shape has formed thru lower highs and higher lows.
I beleive this to be a symmetrical Triangle (overview of this pattern below). Well I cant be wrong since I analysed it from two chart models
A Symmetrical triangles marks important trend reversals or continuation of the current trend.
It was said that; regardless of the nature of the pattern, continuation or reversal, the direction of the next major move can only be determined after a valid breakout.
Now we also have a breakout with an improved volume participation. But wonder whether this is enuf??
I've drawn 2 parellel lines (green lines) where a confirmative target is desired.
Therefore this to be a continuation trend, ASI has to break 5200-5260 range (sorry!! my vision has some problem or the bloomberg chart though clear enuf, not clear in range targets).
The closest Fibonacci resistance (23%) is given as 5462. But the DFN figures dont match with visual figures. Hence I expect the range for 23% Fib to be in 5320-5340
In conclution, we have to expect the ASI to break 5200-5260 range for a better confirmation, then we have to watch the breaking of 23% Fib (5320-5340) to be identified as a true bull
Today (24-08-12) market tradin at a negative note..
Note : Even sophisticateed traders have agreed that the reversal patterns can be especially difficult to analyze and often have false breakouts.
Cons or Word of caution - This can eventually be a fake trend till a new SEC head is appointed and the approval of resignation of ex-SEC chief. So better take positions carefully.
The symmetrical Triangle (Continuation)
The symmetrical Triangle (Continuation) is formed out of two converging trend lines and is neither bullish nor bearish in terms of future price direction (it can be a continuation or reversal pattern)
The triangle pattern usually has two or three tops and bottoms, forming the basis for trend lines and afterwards you can expect the trend line to be broken. A broker trend line of the triangle pattern suggests the completion of the pattern and this should happen at about 2/3 of the horizontal length of the pattern - much earlier than the trend lines merge.
The volume is normally reducing with the pattern formation, but on the breakout the volume is above average.
This refers to the quiet before the storm, or the tightening consolidation before the breakout.
If the breakout is not supported with higher volume, you should be very careful when trading this pattern.
Breakout Confirmation: For a break to be considered valid, it should be on a closing basis. Some traders apply a price (3% break) or time (sustained for 3 days) filter to confirm validity. The breakout should occur with an expansion in volume, especially on upside breakouts.
Confirmation is especially important for upside breakouts.
source : http://stockcharts.com
Last edited by smallville on Fri Aug 24, 2012 12:07 pm; edited 3 times in total (Reason for editing : uploaded DFN's ASI chart.)